
Advertisement
- Australia
- /
- Hospitality
- /
- ASX:BET
Take Care Before Jumping Onto Betmakers Technology Group Ltd (ASX:BET) Even Though It's 28% Cheaper
Betmakers Technology Group Ltd (ASX:BET) shares have retraced a considerable 28% in the last month, reversing a fair amount of their solid recent performance. Instead of being rewarded, shareholders who have already held through the last twelve months are now sitting on a 35% share price drop.
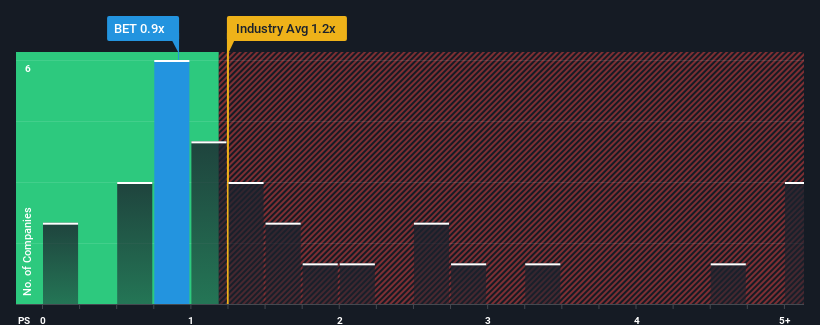
Although its price has dipped substantially, you could still be forgiven for feeling indifferent about Betmakers Technology Group's P/S ratio of 0.9x, since the median price-to-sales (or "P/S") ratio for the Hospitality industry in Australia is also close to 1.2x. However, investors might be overlooking a clear opportunity or potential setback if there is no rational basis for the P/S.
Check out our latest analysis for Betmakers Technology Group
What Does Betmakers Technology Group's Recent Performance Look Like?
The recent revenue growth at Betmakers Technology Group would have to be considered satisfactory if not spectacular. It might be that many expect the respectable revenue performance to only match most other companies over the coming period, which has kept the P/S from rising. Those who are bullish on Betmakers Technology Group will be hoping that this isn't the case, so that they can pick up the stock at a lower valuation.
Want the full picture on earnings, revenue and cash flow for the company? Then our free report on Betmakers Technology Group will help you shine a light on its historical performance.Do Revenue Forecasts Match The P/S Ratio?
Betmakers Technology Group's P/S ratio would be typical for a company that's only expected to deliver moderate growth, and importantly, perform in line with the industry.
Retrospectively, the last year delivered a decent 5.0% gain to the company's revenues. The latest three year period has seen an incredible overall rise in revenue, even though the last 12 month performance was only fair. Accordingly, shareholders would have been over the moon with those medium-term rates of revenue growth.
When compared to the industry's one-year growth forecast of 9.0%, the most recent medium-term revenue trajectory is noticeably more alluring
With this information, we find it interesting that Betmakers Technology Group is trading at a fairly similar P/S compared to the industry. Apparently some shareholders believe the recent performance is at its limits and have been accepting lower selling prices.
The Bottom Line On Betmakers Technology Group's P/S
Betmakers Technology Group's plummeting stock price has brought its P/S back to a similar region as the rest of the industry. While the price-to-sales ratio shouldn't be the defining factor in whether you buy a stock or not, it's quite a capable barometer of revenue expectations.
We didn't quite envision Betmakers Technology Group's P/S sitting in line with the wider industry, considering the revenue growth over the last three-year is higher than the current industry outlook. When we see strong revenue with faster-than-industry growth, we can only assume potential risks are what might be placing pressure on the P/S ratio. It appears some are indeed anticipating revenue instability, because the persistence of these recent medium-term conditions would normally provide a boost to the share price.
It is also worth noting that we have found 4 warning signs for Betmakers Technology Group (1 makes us a bit uncomfortable!) that you need to take into consideration.
If strong companies turning a profit tickle your fancy, then you'll want to check out this free list of interesting companies that trade on a low P/E (but have proven they can grow earnings).
Valuation is complex, but we're here to simplify it.
Discover if Betmakers Technology Group might be undervalued or overvalued with our detailed analysis, featuring fair value estimates, potential risks, dividends, insider trades, and its financial condition.
Access Free AnalysisHave feedback on this article? Concerned about the content? Get in touch with us directly. Alternatively, email editorial-team (at) simplywallst.com.
This article by Simply Wall St is general in nature. We provide commentary based on historical data and analyst forecasts only using an unbiased methodology and our articles are not intended to be financial advice. It does not constitute a recommendation to buy or sell any stock, and does not take account of your objectives, or your financial situation. We aim to bring you long-term focused analysis driven by fundamental data. Note that our analysis may not factor in the latest price-sensitive company announcements or qualitative material. Simply Wall St has no position in any stocks mentioned.
About ASX:BET
Betmakers Technology Group
Engages in the development and provision of software, data, and analytics products for the B2B wagering market in Australia, New Zealand, the United States, the United Kingdom, Europe, and internationally.
Excellent balance sheet with reasonable growth potential.
Similar Companies
Market Insights

Advertisement
Community Narratives
The Next Phase of Energy Storage: How NeoVolta Is Tackling America’s Power Crunch
Fair Value US$7.50|35.1% undervalued
MA
Community Contributor
Why EnSilica is Worth Possibly 13x its Current Price
Fair Value UK£5.00|89.8% undervalued
DO
Community Contributor
M&A Activity, Industry Diversification & A Defense Contract Monopoly Will Push BWXT For Healthy Long-Term Growth
Fair Value US$220.00|15.2% undervalued
CL
Community Contributor
A case for Cassiar Gold Corp (TSXV: GLDC) to reach CAD$8-10 before 2030 (X30-37)
Fair Value CA$10.00|96.0% undervalued
AG
Community Contributor