
Advertisement
- Australia
- /
- Food and Staples Retail
- /
- ASX:WOW
Is There An Opportunity With Woolworths Group Limited's (ASX:WOW) 22% Undervaluation?
Key Insights
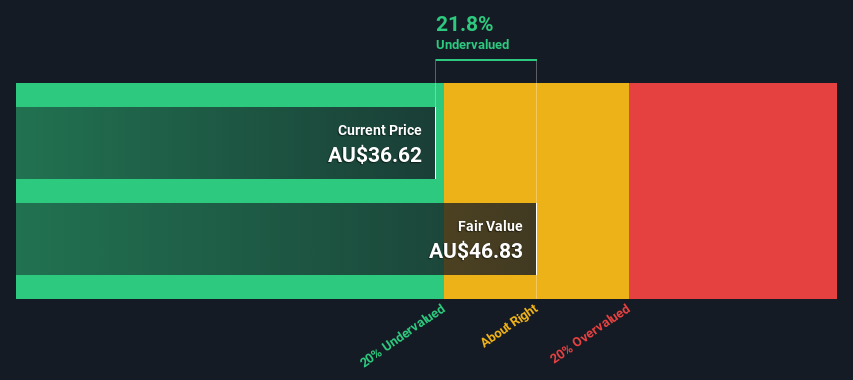
- Woolworths Group's estimated fair value is AU$46.83 based on 2 Stage Free Cash Flow to Equity
- Woolworths Group is estimated to be 22% undervalued based on current share price of AU$36.62
- Analyst price target for WOW is AU$35.82 which is 24% below our fair value estimate
Today we will run through one way of estimating the intrinsic value of Woolworths Group Limited (ASX:WOW) by taking the expected future cash flows and discounting them to their present value. We will use the Discounted Cash Flow (DCF) model on this occasion. There's really not all that much to it, even though it might appear quite complex.
We would caution that there are many ways of valuing a company and, like the DCF, each technique has advantages and disadvantages in certain scenarios. Anyone interested in learning a bit more about intrinsic value should have a read of the Simply Wall St analysis model.
See our latest analysis for Woolworths Group
Step By Step Through The Calculation
We're using the 2-stage growth model, which simply means we take in account two stages of company's growth. In the initial period the company may have a higher growth rate and the second stage is usually assumed to have a stable growth rate. To start off with, we need to estimate the next ten years of cash flows. Where possible we use analyst estimates, but when these aren't available we extrapolate the previous free cash flow (FCF) from the last estimate or reported value. We assume companies with shrinking free cash flow will slow their rate of shrinkage, and that companies with growing free cash flow will see their growth rate slow, over this period. We do this to reflect that growth tends to slow more in the early years than it does in later years.
A DCF is all about the idea that a dollar in the future is less valuable than a dollar today, and so the sum of these future cash flows is then discounted to today's value:
10-year free cash flow (FCF) forecast
| 2025 | 2026 | 2027 | 2028 | 2029 | 2030 | 2031 | 2032 | 2033 | 2034 | |
| Levered FCF (A$, Millions) | AU$2.53b | AU$2.82b | AU$3.03b | AU$2.39b | AU$2.46b | AU$2.37b | AU$2.32b | AU$2.31b | AU$2.32b | AU$2.34b |
| Growth Rate Estimate Source | Analyst x2 | Analyst x3 | Analyst x3 | Analyst x1 | Analyst x1 | Est @ -3.77% | Est @ -1.92% | Est @ -0.62% | Est @ 0.29% | Est @ 0.93% |
| Present Value (A$, Millions) Discounted @ 5.9% | AU$2.4k | AU$2.5k | AU$2.6k | AU$1.9k | AU$1.8k | AU$1.7k | AU$1.6k | AU$1.5k | AU$1.4k | AU$1.3k |
("Est" = FCF growth rate estimated by Simply Wall St)
Present Value of 10-year Cash Flow (PVCF) = AU$19b
We now need to calculate the Terminal Value, which accounts for all the future cash flows after this ten year period. For a number of reasons a very conservative growth rate is used that cannot exceed that of a country's GDP growth. In this case we have used the 5-year average of the 10-year government bond yield (2.4%) to estimate future growth. In the same way as with the 10-year 'growth' period, we discount future cash flows to today's value, using a cost of equity of 5.9%.
Terminal Value (TV)= FCF2034 × (1 + g) ÷ (r – g) = AU$2.3b× (1 + 2.4%) ÷ (5.9%– 2.4%) = AU$68b
Present Value of Terminal Value (PVTV)= TV / (1 + r)10= AU$68b÷ ( 1 + 5.9%)10= AU$39b
The total value, or equity value, is then the sum of the present value of the future cash flows, which in this case is AU$57b. To get the intrinsic value per share, we divide this by the total number of shares outstanding. Relative to the current share price of AU$36.6, the company appears a touch undervalued at a 22% discount to where the stock price trades currently. Valuations are imprecise instruments though, rather like a telescope - move a few degrees and end up in a different galaxy. Do keep this in mind.
Important Assumptions
Now the most important inputs to a discounted cash flow are the discount rate, and of course, the actual cash flows. If you don't agree with these result, have a go at the calculation yourself and play with the assumptions. The DCF also does not consider the possible cyclicality of an industry, or a company's future capital requirements, so it does not give a full picture of a company's potential performance. Given that we are looking at Woolworths Group as potential shareholders, the cost of equity is used as the discount rate, rather than the cost of capital (or weighted average cost of capital, WACC) which accounts for debt. In this calculation we've used 5.9%, which is based on a levered beta of 0.848. Beta is a measure of a stock's volatility, compared to the market as a whole. We get our beta from the industry average beta of globally comparable companies, with an imposed limit between 0.8 and 2.0, which is a reasonable range for a stable business.
SWOT Analysis for Woolworths Group
Strength
- Debt is well covered by cash flow.
- Dividends are covered by earnings and cash flows.
Weakness
- Earnings declined over the past year.
- Interest payments on debt are not well covered.
- Dividend is low compared to the top 25% of dividend payers in the Consumer Retailing market.
Opportunity
- Annual earnings are forecast to grow faster than the Australian market.
- Good value based on P/S ratio and estimated fair value.
Threat
- Annual revenue is forecast to grow slower than the Australian market.
Looking Ahead:
Valuation is only one side of the coin in terms of building your investment thesis, and it shouldn't be the only metric you look at when researching a company. The DCF model is not a perfect stock valuation tool. Instead the best use for a DCF model is to test certain assumptions and theories to see if they would lead to the company being undervalued or overvalued. If a company grows at a different rate, or if its cost of equity or risk free rate changes sharply, the output can look very different. What is the reason for the share price sitting below the intrinsic value? For Woolworths Group, we've put together three further aspects you should assess:
- Risks: Take risks, for example - Woolworths Group has 3 warning signs (and 1 which shouldn't be ignored) we think you should know about.
- Future Earnings: How does WOW's growth rate compare to its peers and the wider market? Dig deeper into the analyst consensus number for the upcoming years by interacting with our free analyst growth expectation chart.
- Other Solid Businesses: Low debt, high returns on equity and good past performance are fundamental to a strong business. Why not explore our interactive list of stocks with solid business fundamentals to see if there are other companies you may not have considered!
PS. Simply Wall St updates its DCF calculation for every Australian stock every day, so if you want to find the intrinsic value of any other stock just search here.
Valuation is complex, but we're here to simplify it.
Discover if Woolworths Group might be undervalued or overvalued with our detailed analysis, featuring fair value estimates, potential risks, dividends, insider trades, and its financial condition.
Access Free AnalysisHave feedback on this article? Concerned about the content? Get in touch with us directly. Alternatively, email editorial-team (at) simplywallst.com.
This article by Simply Wall St is general in nature. We provide commentary based on historical data and analyst forecasts only using an unbiased methodology and our articles are not intended to be financial advice. It does not constitute a recommendation to buy or sell any stock, and does not take account of your objectives, or your financial situation. We aim to bring you long-term focused analysis driven by fundamental data. Note that our analysis may not factor in the latest price-sensitive company announcements or qualitative material. Simply Wall St has no position in any stocks mentioned.
About ASX:WOW
Fair value low.
Similar Companies
Market Insights


Advertisement
Community Narratives
Pole position to benefit from GENIUS Act
Fair Value US$233.04|58.8% undervalued
CH
Community Contributor
IREN will transform from bitcoin miner to leader in AI infrastructure
Fair Value US$21.48|17.5% undervalued
KA
Community Contributor
Behind the Assay: XRF Scientific’s Role in Modern Mining Economics
Fair Value AU$2.10|2.4% undervalued
RO
Community Contributor