

Legendary fund manager Li Lu (who Charlie Munger backed) once said, 'The biggest investment risk is not the volatility of prices, but whether you will suffer a permanent loss of capital.' It's only natural to consider a company's balance sheet when you examine how risky it is, since debt is often involved when a business collapses. We can see that Coles Group Limited (ASX:COL) does use debt in its business. But is this debt a concern to shareholders?
Why Does Debt Bring Risk?
Debt is a tool to help businesses grow, but if a business is incapable of paying off its lenders, then it exists at their mercy. Part and parcel of capitalism is the process of 'creative destruction' where failed businesses are mercilessly liquidated by their bankers. However, a more common (but still painful) scenario is that it has to raise new equity capital at a low price, thus permanently diluting shareholders. Of course, the upside of debt is that it often represents cheap capital, especially when it replaces dilution in a company with the ability to reinvest at high rates of return. The first step when considering a company's debt levels is to consider its cash and debt together.
See our latest analysis for Coles Group
What Is Coles Group's Net Debt?
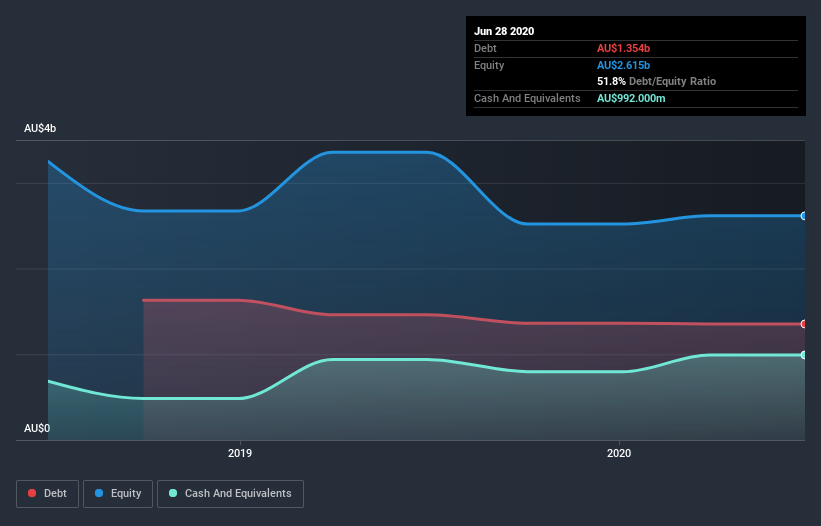
The image below, which you can click on for greater detail, shows that Coles Group had debt of AU$1.35b at the end of June 2020, a reduction from AU$1.46b over a year. However, it also had AU$992.0m in cash, and so its net debt is AU$362.0m.
How Healthy Is Coles Group's Balance Sheet?
Zooming in on the latest balance sheet data, we can see that Coles Group had liabilities of AU$5.68b due within 12 months and liabilities of AU$10.1b due beyond that. Offsetting these obligations, it had cash of AU$992.0m as well as receivables valued at AU$476.0m due within 12 months. So it has liabilities totalling AU$14.3b more than its cash and near-term receivables, combined.
This is a mountain of leverage even relative to its gargantuan market capitalization of AU$22.8b. This suggests shareholders would be heavily diluted if the company needed to shore up its balance sheet in a hurry.
We use two main ratios to inform us about debt levels relative to earnings. The first is net debt divided by earnings before interest, tax, depreciation, and amortization (EBITDA), while the second is how many times its earnings before interest and tax (EBIT) covers its interest expense (or its interest cover, for short). The advantage of this approach is that we take into account both the absolute quantum of debt (with net debt to EBITDA) and the actual interest expenses associated with that debt (with its interest cover ratio).
While Coles Group's low debt to EBITDA ratio of 0.16 suggests only modest use of debt, the fact that EBIT only covered the interest expense by 3.9 times last year does give us pause. So we'd recommend keeping a close eye on the impact financing costs are having on the business. It is well worth noting that Coles Group's EBIT shot up like bamboo after rain, gaining 41% in the last twelve months. That'll make it easier to manage its debt. There's no doubt that we learn most about debt from the balance sheet. But ultimately the future profitability of the business will decide if Coles Group can strengthen its balance sheet over time. So if you're focused on the future you can check out this free report showing analyst profit forecasts.
But our final consideration is also important, because a company cannot pay debt with paper profits; it needs cold hard cash. So it's worth checking how much of that EBIT is backed by free cash flow. Happily for any shareholders, Coles Group actually produced more free cash flow than EBIT over the last two years. There's nothing better than incoming cash when it comes to staying in your lenders' good graces.
Our View
The good news is that Coles Group's demonstrated ability to convert EBIT to free cash flow delights us like a fluffy puppy does a toddler. But truth be told we feel its interest cover does undermine this impression a bit. Taking all this data into account, it seems to us that Coles Group takes a pretty sensible approach to debt. That means they are taking on a bit more risk, in the hope of boosting shareholder returns. The balance sheet is clearly the area to focus on when you are analysing debt. But ultimately, every company can contain risks that exist outside of the balance sheet. For instance, we've identified 2 warning signs for Coles Group that you should be aware of.
At the end of the day, it's often better to focus on companies that are free from net debt. You can access our special list of such companies (all with a track record of profit growth). It's free.
If you decide to trade Coles Group, use the lowest-cost* platform that is rated #1 Overall by Barron’s, Interactive Brokers. Trade stocks, options, futures, forex, bonds and funds on 135 markets, all from a single integrated account. Promoted
If you're looking to trade Coles Group, open an account with the lowest-cost platform trusted by professionals, Interactive Brokers.
With clients in over 200 countries and territories, and access to 160 markets, IBKR lets you trade stocks, options, futures, forex, bonds and funds from a single integrated account.
Enjoy no hidden fees, no account minimums, and FX conversion rates as low as 0.03%, far better than what most brokers offer.
Sponsored ContentNew: AI Stock Screener & Alerts
Our new AI Stock Screener scans the market every day to uncover opportunities.
• Dividend Powerhouses (3%+ Yield)
• Undervalued Small Caps with Insider Buying
• High growth Tech and AI Companies
Or build your own from over 50 metrics.
This article by Simply Wall St is general in nature. It does not constitute a recommendation to buy or sell any stock, and does not take account of your objectives, or your financial situation. We aim to bring you long-term focused analysis driven by fundamental data. Note that our analysis may not factor in the latest price-sensitive company announcements or qualitative material. Simply Wall St has no position in any stocks mentioned.
*Interactive Brokers Rated Lowest Cost Broker by StockBrokers.com Annual Online Review 2020
Have feedback on this article? Concerned about the content? Get in touch with us directly. Alternatively, email editorial-team@simplywallst.com.
About ASX:COL
Outstanding track record with limited growth.
Similar Companies
Market Insights

Community Narratives

