- Australia
- /
- Professional Services
- /
- ASX:PPE
Peoplein (ASX:PPE shareholders incur further losses as stock declines 11% this week, taking three-year losses to 75%


It's not possible to invest over long periods without making some bad investments. But you have a problem if you face massive losses more than once in a while. So consider, for a moment, the misfortune of Peoplein Limited (ASX:PPE) investors who have held the stock for three years as it declined a whopping 77%. That would certainly shake our confidence in the decision to own the stock.
Since Peoplein has shed AU$10m from its value in the past 7 days, let's see if the longer term decline has been driven by the business' economics.
There is no denying that markets are sometimes efficient, but prices do not always reflect underlying business performance. By comparing earnings per share (EPS) and share price changes over time, we can get a feel for how investor attitudes to a company have morphed over time.
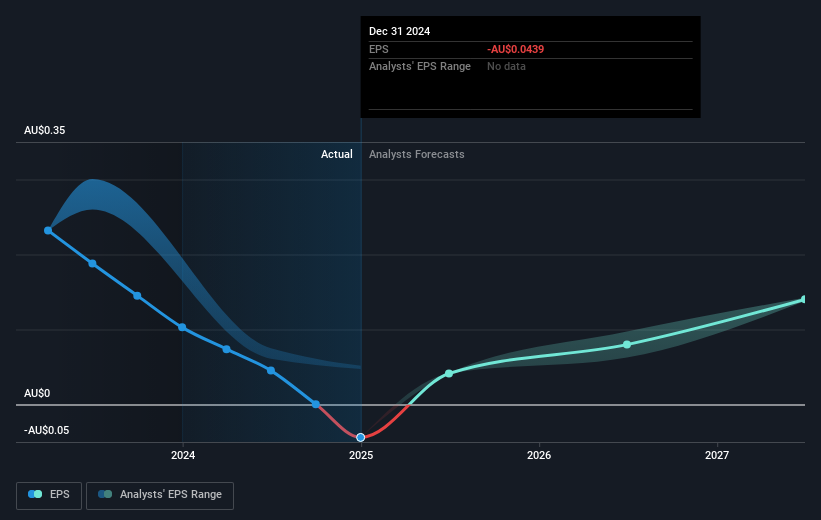
Over the three years that the share price declined, Peoplein's earnings per share (EPS) dropped significantly, falling to a loss. This was, in part, due to extraordinary items impacting earnings. Since the company has fallen to a loss making position, it's hard to compare the change in EPS with the share price change. But it's safe to say we'd generally expect the share price to be lower as a result!
The company's earnings per share (over time) is depicted in the image below (click to see the exact numbers).
We like that insiders have been buying shares in the last twelve months. Having said that, most people consider earnings and revenue growth trends to be a more meaningful guide to the business. Before buying or selling a stock, we always recommend a close examination of historic growth trends, available here..
What About The Total Shareholder Return (TSR)?
We've already covered Peoplein's share price action, but we should also mention its total shareholder return (TSR). Arguably the TSR is a more complete return calculation because it accounts for the value of dividends (as if they were reinvested), along with the hypothetical value of any discounted capital that have been offered to shareholders. Dividends have been really beneficial for Peoplein shareholders, and that cash payout explains why its total shareholder loss of 75%, over the last 3 years, isn't as bad as the share price return.
A Different Perspective
Investors in Peoplein had a tough year, with a total loss of 17%, against a market gain of about 11%. However, keep in mind that even the best stocks will sometimes underperform the market over a twelve month period. Regrettably, last year's performance caps off a bad run, with the shareholders facing a total loss of 10% per year over five years. Generally speaking long term share price weakness can be a bad sign, though contrarian investors might want to research the stock in hope of a turnaround. It's always interesting to track share price performance over the longer term. But to understand Peoplein better, we need to consider many other factors. Consider risks, for instance. Every company has them, and we've spotted 2 warning signs for Peoplein you should know about.
There are plenty of other companies that have insiders buying up shares. You probably do not want to miss this free list of undervalued small cap companies that insiders are buying.
Please note, the market returns quoted in this article reflect the market weighted average returns of stocks that currently trade on Australian exchanges.
If you're looking to trade Peoplein, open an account with the lowest-cost platform trusted by professionals, Interactive Brokers.
With clients in over 200 countries and territories, and access to 160 markets, IBKR lets you trade stocks, options, futures, forex, bonds and funds from a single integrated account.
Enjoy no hidden fees, no account minimums, and FX conversion rates as low as 0.03%, far better than what most brokers offer.
Sponsored ContentNew: Manage All Your Stock Portfolios in One Place
We've created the ultimate portfolio companion for stock investors, and it's free.
• Connect an unlimited number of Portfolios and see your total in one currency
• Be alerted to new Warning Signs or Risks via email or mobile
• Track the Fair Value of your stocks
Have feedback on this article? Concerned about the content? Get in touch with us directly. Alternatively, email editorial-team (at) simplywallst.com.
This article by Simply Wall St is general in nature. We provide commentary based on historical data and analyst forecasts only using an unbiased methodology and our articles are not intended to be financial advice. It does not constitute a recommendation to buy or sell any stock, and does not take account of your objectives, or your financial situation. We aim to bring you long-term focused analysis driven by fundamental data. Note that our analysis may not factor in the latest price-sensitive company announcements or qualitative material. Simply Wall St has no position in any stocks mentioned.
About ASX:PPE
Peoplein
Provides staffing, business, and operational services in Australia, New Zealand, and Singapore.
Very undervalued with adequate balance sheet.
Market Insights

Community Narratives

