
Advertisement
- Australia
- /
- Professional Services
- /
- ASX:KPG
Estimating The Intrinsic Value Of Kelly Partners Group Holdings Limited (ASX:KPG)
Key Insights
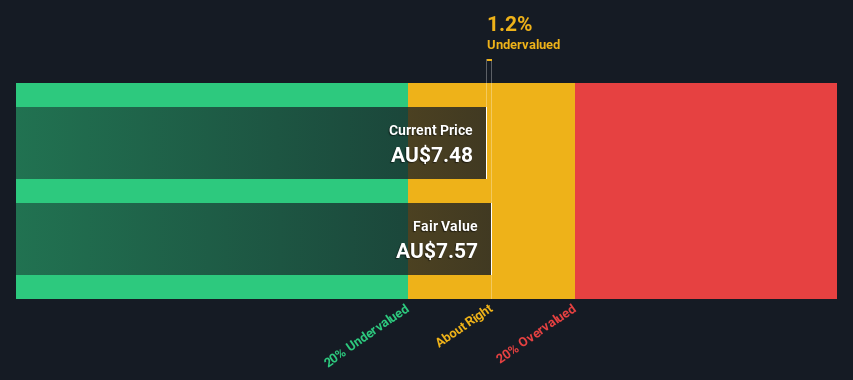
- Kelly Partners Group Holdings' estimated fair value is AU$7.57 based on 2 Stage Free Cash Flow to Equity
- With AU$7.48 share price, Kelly Partners Group Holdings appears to be trading close to its estimated fair value
- When compared to theindustry average discount to fair value of 6.3%, Kelly Partners Group Holdings' competitors seem to be trading at a greater discount
Does the May share price for Kelly Partners Group Holdings Limited (ASX:KPG) reflect what it's really worth? Today, we will estimate the stock's intrinsic value by taking the expected future cash flows and discounting them to their present value. The Discounted Cash Flow (DCF) model is the tool we will apply to do this. Models like these may appear beyond the comprehension of a lay person, but they're fairly easy to follow.
Remember though, that there are many ways to estimate a company's value, and a DCF is just one method. If you still have some burning questions about this type of valuation, take a look at the Simply Wall St analysis model.
View our latest analysis for Kelly Partners Group Holdings
Crunching The Numbers
We use what is known as a 2-stage model, which simply means we have two different periods of growth rates for the company's cash flows. Generally the first stage is higher growth, and the second stage is a lower growth phase. In the first stage we need to estimate the cash flows to the business over the next ten years. Seeing as no analyst estimates of free cash flow are available to us, we have extrapolate the previous free cash flow (FCF) from the company's last reported value. We assume companies with shrinking free cash flow will slow their rate of shrinkage, and that companies with growing free cash flow will see their growth rate slow, over this period. We do this to reflect that growth tends to slow more in the early years than it does in later years.
Generally we assume that a dollar today is more valuable than a dollar in the future, so we need to discount the sum of these future cash flows to arrive at a present value estimate:
10-year free cash flow (FCF) estimate
| 2024 | 2025 | 2026 | 2027 | 2028 | 2029 | 2030 | 2031 | 2032 | 2033 | |
| Levered FCF (A$, Millions) | AU$15.0m | AU$15.3m | AU$15.6m | AU$15.9m | AU$16.3m | AU$16.6m | AU$17.0m | AU$17.4m | AU$17.8m | AU$18.2m |
| Growth Rate Estimate Source | Est @ 1.95% | Est @ 2.04% | Est @ 2.11% | Est @ 2.15% | Est @ 2.19% | Est @ 2.21% | Est @ 2.22% | Est @ 2.23% | Est @ 2.24% | Est @ 2.25% |
| Present Value (A$, Millions) Discounted @ 6.6% | AU$14.0 | AU$13.4 | AU$12.9 | AU$12.3 | AU$11.8 | AU$11.3 | AU$10.9 | AU$10.4 | AU$10.0 | AU$9.6 |
("Est" = FCF growth rate estimated by Simply Wall St)
Present Value of 10-year Cash Flow (PVCF) = AU$117m
After calculating the present value of future cash flows in the initial 10-year period, we need to calculate the Terminal Value, which accounts for all future cash flows beyond the first stage. The Gordon Growth formula is used to calculate Terminal Value at a future annual growth rate equal to the 5-year average of the 10-year government bond yield of 2.3%. We discount the terminal cash flows to today's value at a cost of equity of 6.6%.
Terminal Value (TV)= FCF2033 × (1 + g) ÷ (r – g) = AU$18m× (1 + 2.3%) ÷ (6.6%– 2.3%) = AU$426m
Present Value of Terminal Value (PVTV)= TV / (1 + r)10= AU$426m÷ ( 1 + 6.6%)10= AU$224m
The total value is the sum of cash flows for the next ten years plus the discounted terminal value, which results in the Total Equity Value, which in this case is AU$341m. In the final step we divide the equity value by the number of shares outstanding. Compared to the current share price of AU$7.5, the company appears about fair value at a 1.2% discount to where the stock price trades currently. Valuations are imprecise instruments though, rather like a telescope - move a few degrees and end up in a different galaxy. Do keep this in mind.
The Assumptions
The calculation above is very dependent on two assumptions. The first is the discount rate and the other is the cash flows. Part of investing is coming up with your own evaluation of a company's future performance, so try the calculation yourself and check your own assumptions. The DCF also does not consider the possible cyclicality of an industry, or a company's future capital requirements, so it does not give a full picture of a company's potential performance. Given that we are looking at Kelly Partners Group Holdings as potential shareholders, the cost of equity is used as the discount rate, rather than the cost of capital (or weighted average cost of capital, WACC) which accounts for debt. In this calculation we've used 6.6%, which is based on a levered beta of 0.949. Beta is a measure of a stock's volatility, compared to the market as a whole. We get our beta from the industry average beta of globally comparable companies, with an imposed limit between 0.8 and 2.0, which is a reasonable range for a stable business.
SWOT Analysis for Kelly Partners Group Holdings
Strength
- Debt is well covered by earnings and cashflows.
Weakness
- Earnings declined over the past year.
- Dividend is low compared to the top 25% of dividend payers in the Professional Services market.
Opportunity
- Current share price is below our estimate of fair value.
- Lack of analyst coverage makes it difficult to determine KPG's earnings prospects.
Threat
- No apparent threats visible for KPG.
Moving On:
Whilst important, the DCF calculation is only one of many factors that you need to assess for a company. DCF models are not the be-all and end-all of investment valuation. Instead the best use for a DCF model is to test certain assumptions and theories to see if they would lead to the company being undervalued or overvalued. For example, changes in the company's cost of equity or the risk free rate can significantly impact the valuation. For Kelly Partners Group Holdings, there are three additional elements you should explore:
- Risks: To that end, you should be aware of the 3 warning signs we've spotted with Kelly Partners Group Holdings .
- Management:Have insiders been ramping up their shares to take advantage of the market's sentiment for KPG's future outlook? Check out our management and board analysis with insights on CEO compensation and governance factors.
- Other High Quality Alternatives: Do you like a good all-rounder? Explore our interactive list of high quality stocks to get an idea of what else is out there you may be missing!
PS. Simply Wall St updates its DCF calculation for every Australian stock every day, so if you want to find the intrinsic value of any other stock just search here.
Valuation is complex, but we're here to simplify it.
Discover if Kelly Partners Group Holdings might be undervalued or overvalued with our detailed analysis, featuring fair value estimates, potential risks, dividends, insider trades, and its financial condition.
Access Free AnalysisHave feedback on this article? Concerned about the content? Get in touch with us directly. Alternatively, email editorial-team (at) simplywallst.com.
This article by Simply Wall St is general in nature. We provide commentary based on historical data and analyst forecasts only using an unbiased methodology and our articles are not intended to be financial advice. It does not constitute a recommendation to buy or sell any stock, and does not take account of your objectives, or your financial situation. We aim to bring you long-term focused analysis driven by fundamental data. Note that our analysis may not factor in the latest price-sensitive company announcements or qualitative material. Simply Wall St has no position in any stocks mentioned.
About ASX:KPG
Kelly Partners Group Holdings
Provides chartered accounting and other professional services to private businesses and high net worth individuals in Australia and internationally.
Low risk and slightly overvalued.
Market Insights

Advertisement
Community Narratives
Quality at a Premium. A time to watch, not to buy?
Fair Value US$154.56|30.1% undervalued
DA
Community Contributor
GRAB: The Super-App at the Heart of Southeast Asia’s Digital Boom
Fair Value US$8.20|25.6% undervalued
BL
Community Contributor
Verve Group to Surge with 51.61% Revenue Growth
Fair Value €6.00|63.2% undervalued
ME
Community Contributor