- Australia
- /
- Commercial Services
- /
- ASX:AMA
Even With A 29% Surge, Cautious Investors Are Not Rewarding AMA Group Limited's (ASX:AMA) Performance Completely


AMA Group Limited (ASX:AMA) shareholders would be excited to see that the share price has had a great month, posting a 29% gain and recovering from prior weakness. Still, the 30-day jump doesn't change the fact that longer term shareholders have seen their stock decimated by the 52% share price drop in the last twelve months.
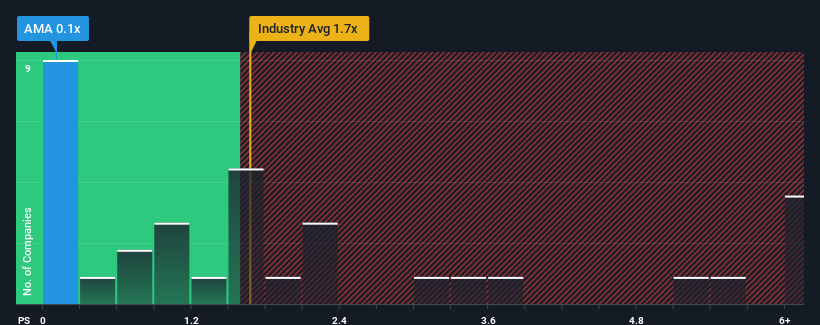
Even after such a large jump in price, AMA Group may still be sending buy signals at present with its price-to-sales (or "P/S") ratio of 0.1x, considering almost half of all companies in the Commercial Services industry in Australia have P/S ratios greater than 1.7x and even P/S higher than 4x aren't out of the ordinary. Nonetheless, we'd need to dig a little deeper to determine if there is a rational basis for the reduced P/S.
Check out our latest analysis for AMA Group
How AMA Group Has Been Performing
With revenue growth that's inferior to most other companies of late, AMA Group has been relatively sluggish. The P/S ratio is probably low because investors think this lacklustre revenue performance isn't going to get any better. If this is the case, then existing shareholders will probably struggle to get excited about the future direction of the share price.
Want the full picture on analyst estimates for the company? Then our free report on AMA Group will help you uncover what's on the horizon.How Is AMA Group's Revenue Growth Trending?
In order to justify its P/S ratio, AMA Group would need to produce sluggish growth that's trailing the industry.
If we review the last year of revenue growth, the company posted a worthy increase of 7.0%. Still, revenue has barely risen at all in aggregate from three years ago, which is not ideal. Accordingly, shareholders probably wouldn't have been overly satisfied with the unstable medium-term growth rates.
Turning to the outlook, the next year should generate growth of 6.9% as estimated by the three analysts watching the company. Meanwhile, the rest of the industry is forecast to only expand by 4.2%, which is noticeably less attractive.
In light of this, it's peculiar that AMA Group's P/S sits below the majority of other companies. It looks like most investors are not convinced at all that the company can achieve future growth expectations.
What We Can Learn From AMA Group's P/S?
Despite AMA Group's share price climbing recently, its P/S still lags most other companies. Using the price-to-sales ratio alone to determine if you should sell your stock isn't sensible, however it can be a practical guide to the company's future prospects.
AMA Group's analyst forecasts revealed that its superior revenue outlook isn't contributing to its P/S anywhere near as much as we would have predicted. When we see strong growth forecasts like this, we can only assume potential risks are what might be placing significant pressure on the P/S ratio. While the possibility of the share price plunging seems unlikely due to the high growth forecasted for the company, the market does appear to have some hesitation.
We don't want to rain on the parade too much, but we did also find 2 warning signs for AMA Group (1 is concerning!) that you need to be mindful of.
Of course, profitable companies with a history of great earnings growth are generally safer bets. So you may wish to see this free collection of other companies that have reasonable P/E ratios and have grown earnings strongly.
New: Manage All Your Stock Portfolios in One Place
We've created the ultimate portfolio companion for stock investors, and it's free.
• Connect an unlimited number of Portfolios and see your total in one currency
• Be alerted to new Warning Signs or Risks via email or mobile
• Track the Fair Value of your stocks
Have feedback on this article? Concerned about the content? Get in touch with us directly. Alternatively, email editorial-team (at) simplywallst.com.
This article by Simply Wall St is general in nature. We provide commentary based on historical data and analyst forecasts only using an unbiased methodology and our articles are not intended to be financial advice. It does not constitute a recommendation to buy or sell any stock, and does not take account of your objectives, or your financial situation. We aim to bring you long-term focused analysis driven by fundamental data. Note that our analysis may not factor in the latest price-sensitive company announcements or qualitative material. Simply Wall St has no position in any stocks mentioned.
Have feedback on this article? Concerned about the content? Get in touch with us directly. Alternatively, email editorial-team@simplywallst.com
About ASX:AMA
AMA Group
Engages in the development and operation of collision repair business in Australia and New Zealand.
Very undervalued with moderate growth potential.
Similar Companies
Market Insights

Community Narratives


