Calculating The Intrinsic Value Of Zicom Group Limited (ASX:ZGL)


Key Insights
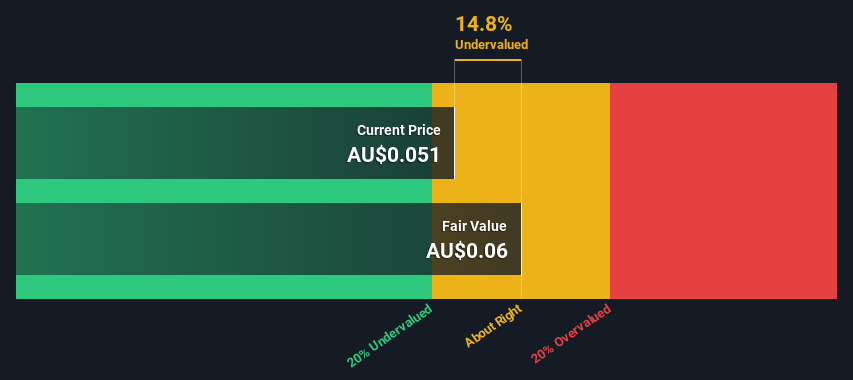
- The projected fair value for Zicom Group is AU$0.06 based on 2 Stage Free Cash Flow to Equity
- Zicom Group's AU$0.051 share price indicates it is trading at similar levels as its fair value estimate
- Industry average discount to fair value of 12% suggests Zicom Group's peers are currently trading at a lower discount
Today we will run through one way of estimating the intrinsic value of Zicom Group Limited (ASX:ZGL) by taking the expected future cash flows and discounting them to their present value. We will use the Discounted Cash Flow (DCF) model on this occasion. Don't get put off by the jargon, the math behind it is actually quite straightforward.
We generally believe that a company's value is the present value of all of the cash it will generate in the future. However, a DCF is just one valuation metric among many, and it is not without flaws. Anyone interested in learning a bit more about intrinsic value should have a read of the Simply Wall St analysis model.
See our latest analysis for Zicom Group
The Model
We are going to use a two-stage DCF model, which, as the name states, takes into account two stages of growth. The first stage is generally a higher growth period which levels off heading towards the terminal value, captured in the second 'steady growth' period. In the first stage we need to estimate the cash flows to the business over the next ten years. Seeing as no analyst estimates of free cash flow are available to us, we have extrapolate the previous free cash flow (FCF) from the company's last reported value. We assume companies with shrinking free cash flow will slow their rate of shrinkage, and that companies with growing free cash flow will see their growth rate slow, over this period. We do this to reflect that growth tends to slow more in the early years than it does in later years.
Generally we assume that a dollar today is more valuable than a dollar in the future, so we need to discount the sum of these future cash flows to arrive at a present value estimate:
10-year free cash flow (FCF) forecast
| 2024 | 2025 | 2026 | 2027 | 2028 | 2029 | 2030 | 2031 | 2032 | 2033 | |
| Levered FCF (SGD, Millions) | S$1.70m | S$1.41m | S$1.26m | S$1.17m | S$1.12m | S$1.09m | S$1.08m | S$1.08m | S$1.09m | S$1.10m |
| Growth Rate Estimate Source | Est @ -24.90% | Est @ -16.75% | Est @ -11.05% | Est @ -7.05% | Est @ -4.26% | Est @ -2.30% | Est @ -0.93% | Est @ 0.02% | Est @ 0.69% | Est @ 1.16% |
| Present Value (SGD, Millions) Discounted @ 11% | S$1.5 | S$1.1 | S$0.9 | S$0.8 | S$0.7 | S$0.6 | S$0.5 | S$0.5 | S$0.4 | S$0.4 |
("Est" = FCF growth rate estimated by Simply Wall St)
Present Value of 10-year Cash Flow (PVCF) = S$7.3m
The second stage is also known as Terminal Value, this is the business's cash flow after the first stage. For a number of reasons a very conservative growth rate is used that cannot exceed that of a country's GDP growth. In this case we have used the 5-year average of the 10-year government bond yield (2.3%) to estimate future growth. In the same way as with the 10-year 'growth' period, we discount future cash flows to today's value, using a cost of equity of 11%.
Terminal Value (TV)= FCF2033 × (1 + g) ÷ (r – g) = S$1.1m× (1 + 2.3%) ÷ (11%– 2.3%) = S$12m
Present Value of Terminal Value (PVTV)= TV / (1 + r)10= S$12m÷ ( 1 + 11%)10= S$4.1m
The total value, or equity value, is then the sum of the present value of the future cash flows, which in this case is S$11m. In the final step we divide the equity value by the number of shares outstanding. Compared to the current share price of AU$0.05, the company appears about fair value at a 15% discount to where the stock price trades currently. Valuations are imprecise instruments though, rather like a telescope - move a few degrees and end up in a different galaxy. Do keep this in mind.
The Assumptions
We would point out that the most important inputs to a discounted cash flow are the discount rate and of course the actual cash flows. You don't have to agree with these inputs, I recommend redoing the calculations yourself and playing with them. The DCF also does not consider the possible cyclicality of an industry, or a company's future capital requirements, so it does not give a full picture of a company's potential performance. Given that we are looking at Zicom Group as potential shareholders, the cost of equity is used as the discount rate, rather than the cost of capital (or weighted average cost of capital, WACC) which accounts for debt. In this calculation we've used 11%, which is based on a levered beta of 2.000. Beta is a measure of a stock's volatility, compared to the market as a whole. We get our beta from the industry average beta of globally comparable companies, with an imposed limit between 0.8 and 2.0, which is a reasonable range for a stable business.
Moving On:
Although the valuation of a company is important, it ideally won't be the sole piece of analysis you scrutinize for a company. The DCF model is not a perfect stock valuation tool. Preferably you'd apply different cases and assumptions and see how they would impact the company's valuation. For instance, if the terminal value growth rate is adjusted slightly, it can dramatically alter the overall result. For Zicom Group, there are three additional items you should assess:
- Risks: For instance, we've identified 3 warning signs for Zicom Group that you should be aware of.
- Other High Quality Alternatives: Do you like a good all-rounder? Explore our interactive list of high quality stocks to get an idea of what else is out there you may be missing!
- Other Environmentally-Friendly Companies: Concerned about the environment and think consumers will buy eco-friendly products more and more? Browse through our interactive list of companies that are thinking about a greener future to discover some stocks you may not have thought of!
PS. Simply Wall St updates its DCF calculation for every Australian stock every day, so if you want to find the intrinsic value of any other stock just search here.
Valuation is complex, but we're here to simplify it.
Discover if Zicom Group might be undervalued or overvalued with our detailed analysis, featuring fair value estimates, potential risks, dividends, insider trades, and its financial condition.
Access Free AnalysisHave feedback on this article? Concerned about the content? Get in touch with us directly. Alternatively, email editorial-team (at) simplywallst.com.
This article by Simply Wall St is general in nature. We provide commentary based on historical data and analyst forecasts only using an unbiased methodology and our articles are not intended to be financial advice. It does not constitute a recommendation to buy or sell any stock, and does not take account of your objectives, or your financial situation. We aim to bring you long-term focused analysis driven by fundamental data. Note that our analysis may not factor in the latest price-sensitive company announcements or qualitative material. Simply Wall St has no position in any stocks mentioned.
About ASX:ZGL
Zicom Group
Manufactures and sells marine deck machinery, fluid regulating and metering stations, transit concrete mixers, foundation and geotechnical equipment, and precision engineered and automation equipment in Australia, the Philippines, Singapore, China, Bangladesh, and internationally.
Slight with acceptable track record.
Market Insights

Community Narratives

