
Advertisement
Oldfields Holdings Limited (ASX:OLH) Surges 25% Yet Its Low P/S Is No Reason For Excitement
Despite an already strong run, Oldfields Holdings Limited (ASX:OLH) shares have been powering on, with a gain of 25% in the last thirty days. Notwithstanding the latest gain, the annual share price return of 5.3% isn't as impressive.
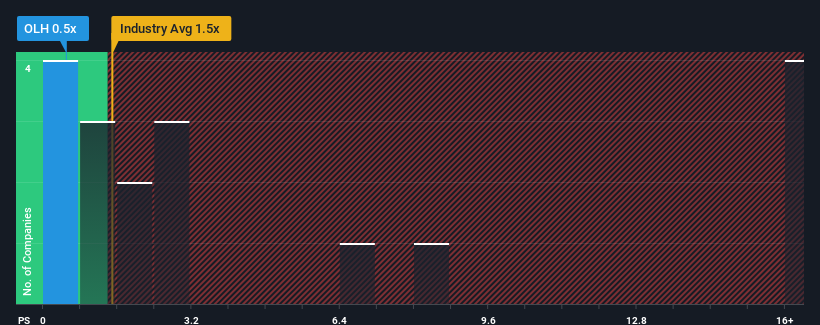
Although its price has surged higher, Oldfields Holdings may still be sending bullish signals at the moment with its price-to-sales (or "P/S") ratio of 0.5x, since almost half of all companies in the Machinery industry in Australia have P/S ratios greater than 2x and even P/S higher than 23x are not unusual. However, the P/S might be low for a reason and it requires further investigation to determine if it's justified.
See our latest analysis for Oldfields Holdings
What Does Oldfields Holdings' P/S Mean For Shareholders?
For instance, Oldfields Holdings' receding revenue in recent times would have to be some food for thought. Perhaps the market believes the recent revenue performance isn't good enough to keep up the industry, causing the P/S ratio to suffer. If you like the company, you'd be hoping this isn't the case so that you could potentially pick up some stock while it's out of favour.
We don't have analyst forecasts, but you can see how recent trends are setting up the company for the future by checking out our free report on Oldfields Holdings' earnings, revenue and cash flow.How Is Oldfields Holdings' Revenue Growth Trending?
Oldfields Holdings' P/S ratio would be typical for a company that's only expected to deliver limited growth, and importantly, perform worse than the industry.
Taking a look back first, the company's revenue growth last year wasn't something to get excited about as it posted a disappointing decline of 1.6%. Even so, admirably revenue has lifted 37% in aggregate from three years ago, notwithstanding the last 12 months. Accordingly, while they would have preferred to keep the run going, shareholders would definitely welcome the medium-term rates of revenue growth.
Comparing that to the industry, which is predicted to deliver 105% growth in the next 12 months, the company's momentum is weaker, based on recent medium-term annualised revenue results.
With this information, we can see why Oldfields Holdings is trading at a P/S lower than the industry. Apparently many shareholders weren't comfortable holding on to something they believe will continue to trail the wider industry.
What We Can Learn From Oldfields Holdings' P/S?
The latest share price surge wasn't enough to lift Oldfields Holdings' P/S close to the industry median. It's argued the price-to-sales ratio is an inferior measure of value within certain industries, but it can be a powerful business sentiment indicator.
In line with expectations, Oldfields Holdings maintains its low P/S on the weakness of its recent three-year growth being lower than the wider industry forecast. Right now shareholders are accepting the low P/S as they concede future revenue probably won't provide any pleasant surprises. Unless the recent medium-term conditions improve, they will continue to form a barrier for the share price around these levels.
Having said that, be aware Oldfields Holdings is showing 3 warning signs in our investment analysis, and 2 of those make us uncomfortable.
If these risks are making you reconsider your opinion on Oldfields Holdings, explore our interactive list of high quality stocks to get an idea of what else is out there.
New: AI Stock Screener & Alerts
Our new AI Stock Screener scans the market every day to uncover opportunities.
• Dividend Powerhouses (3%+ Yield)
• Undervalued Small Caps with Insider Buying
• High growth Tech and AI Companies
Or build your own from over 50 metrics.
Have feedback on this article? Concerned about the content? Get in touch with us directly. Alternatively, email editorial-team (at) simplywallst.com.
This article by Simply Wall St is general in nature. We provide commentary based on historical data and analyst forecasts only using an unbiased methodology and our articles are not intended to be financial advice. It does not constitute a recommendation to buy or sell any stock, and does not take account of your objectives, or your financial situation. We aim to bring you long-term focused analysis driven by fundamental data. Note that our analysis may not factor in the latest price-sensitive company announcements or qualitative material. Simply Wall St has no position in any stocks mentioned.
About ASX:OLH
Oldfields Holdings
Engages in the provision of scaffolding and painting accessories in Australia, New Zealand, and internationally.
Moderate risk and slightly overvalued.
Market Insights

Advertisement
Community Narratives
The company that turned a verb into a global necessity and basically runs the modern internet, digital ads, smartphones, maps, and AI.
Fair Value US$300.00|8.5% undervalued
OS
Community Contributor
Flowers Foods Pays A Fair Price For Health
Fair Value US$16.12|24.6% undervalued
NV
Community Contributor
TMX Group will thrive with 33.3% profit margin and enduring market moat
Fair Value CA$49.90|0.1% undervalued
LI
Community Contributor