- Australia
- /
- Electrical
- /
- ASX:MYG
Mayfield Group Holdings Limited's (ASX:MYG) Shares Climb 31% But Its Business Is Yet to Catch Up


Mayfield Group Holdings Limited (ASX:MYG) shareholders would be excited to see that the share price has had a great month, posting a 31% gain and recovering from prior weakness. The last 30 days bring the annual gain to a very sharp 53%.
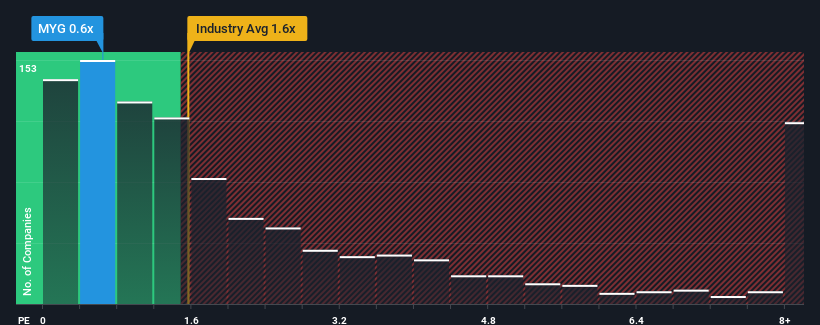
In spite of the firm bounce in price, it's still not a stretch to say that Mayfield Group Holdings' price-to-sales (or "P/S") ratio of 0.6x right now seems quite "middle-of-the-road" compared to the Electrical industry in Australia, where the median P/S ratio is around 1.1x. While this might not raise any eyebrows, if the P/S ratio is not justified investors could be missing out on a potential opportunity or ignoring looming disappointment.
Check out our latest analysis for Mayfield Group Holdings
What Does Mayfield Group Holdings' P/S Mean For Shareholders?
For instance, Mayfield Group Holdings' receding revenue in recent times would have to be some food for thought. Perhaps investors believe the recent revenue performance is enough to keep in line with the industry, which is keeping the P/S from dropping off. If you like the company, you'd at least be hoping this is the case so that you could potentially pick up some stock while it's not quite in favour.
Although there are no analyst estimates available for Mayfield Group Holdings, take a look at this free data-rich visualisation to see how the company stacks up on earnings, revenue and cash flow.How Is Mayfield Group Holdings' Revenue Growth Trending?
In order to justify its P/S ratio, Mayfield Group Holdings would need to produce growth that's similar to the industry.
In reviewing the last year of financials, we were disheartened to see the company's revenues fell to the tune of 5.5%. That put a dampener on the good run it was having over the longer-term as its three-year revenue growth is still a noteworthy 29% in total. So we can start by confirming that the company has generally done a good job of growing revenue over that time, even though it had some hiccups along the way.
Comparing the recent medium-term revenue trends against the industry's one-year growth forecast of 21% shows it's noticeably less attractive.
With this information, we find it interesting that Mayfield Group Holdings is trading at a fairly similar P/S compared to the industry. Apparently many investors in the company are less bearish than recent times would indicate and aren't willing to let go of their stock right now. Maintaining these prices will be difficult to achieve as a continuation of recent revenue trends is likely to weigh down the shares eventually.
What Does Mayfield Group Holdings' P/S Mean For Investors?
Mayfield Group Holdings' stock has a lot of momentum behind it lately, which has brought its P/S level with the rest of the industry. We'd say the price-to-sales ratio's power isn't primarily as a valuation instrument but rather to gauge current investor sentiment and future expectations.
Our examination of Mayfield Group Holdings revealed its poor three-year revenue trends aren't resulting in a lower P/S as per our expectations, given they look worse than current industry outlook. When we see weak revenue with slower than industry growth, we suspect the share price is at risk of declining, bringing the P/S back in line with expectations. Unless there is a significant improvement in the company's medium-term performance, it will be difficult to prevent the P/S ratio from declining to a more reasonable level.
You should always think about risks. Case in point, we've spotted 4 warning signs for Mayfield Group Holdings you should be aware of, and 1 of them is a bit concerning.
Of course, profitable companies with a history of great earnings growth are generally safer bets. So you may wish to see this free collection of other companies that have reasonable P/E ratios and have grown earnings strongly.
New: Manage All Your Stock Portfolios in One Place
We've created the ultimate portfolio companion for stock investors, and it's free.
• Connect an unlimited number of Portfolios and see your total in one currency
• Be alerted to new Warning Signs or Risks via email or mobile
• Track the Fair Value of your stocks
Have feedback on this article? Concerned about the content? Get in touch with us directly. Alternatively, email editorial-team (at) simplywallst.com.
This article by Simply Wall St is general in nature. We provide commentary based on historical data and analyst forecasts only using an unbiased methodology and our articles are not intended to be financial advice. It does not constitute a recommendation to buy or sell any stock, and does not take account of your objectives, or your financial situation. We aim to bring you long-term focused analysis driven by fundamental data. Note that our analysis may not factor in the latest price-sensitive company announcements or qualitative material. Simply Wall St has no position in any stocks mentioned.
About ASX:MYG
Mayfield Group Holdings
Provides electrical and telecommunications infrastructure products and services in Australia.
Flawless balance sheet second-rate dividend payer.

