
Advertisement
Warren Buffett famously said, 'Volatility is far from synonymous with risk.' When we think about how risky a company is, we always like to look at its use of debt, since debt overload can lead to ruin. As with many other companies Johns Lyng Group Limited (ASX:JLG) makes use of debt. But is this debt a concern to shareholders?
When Is Debt A Problem?
Generally speaking, debt only becomes a real problem when a company can't easily pay it off, either by raising capital or with its own cash flow. Ultimately, if the company can't fulfill its legal obligations to repay debt, shareholders could walk away with nothing. However, a more common (but still painful) scenario is that it has to raise new equity capital at a low price, thus permanently diluting shareholders. Having said that, the most common situation is where a company manages its debt reasonably well - and to its own advantage. When we examine debt levels, we first consider both cash and debt levels, together.
Check out our latest analysis for Johns Lyng Group
How Much Debt Does Johns Lyng Group Carry?
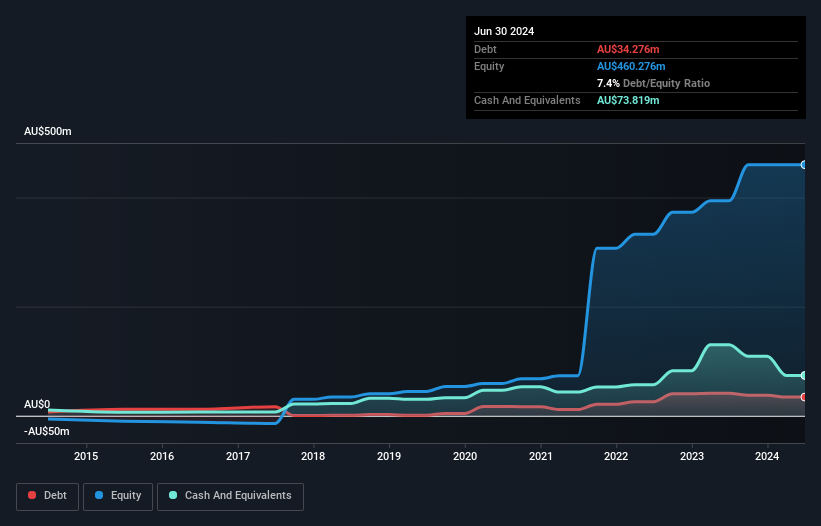
The image below, which you can click on for greater detail, shows that Johns Lyng Group had debt of AU$34.3m at the end of June 2024, a reduction from AU$41.4m over a year. But it also has AU$73.8m in cash to offset that, meaning it has AU$39.5m net cash.
A Look At Johns Lyng Group's Liabilities
According to the last reported balance sheet, Johns Lyng Group had liabilities of AU$261.8m due within 12 months, and liabilities of AU$64.0m due beyond 12 months. Offsetting these obligations, it had cash of AU$73.8m as well as receivables valued at AU$247.4m due within 12 months. So these liquid assets roughly match the total liabilities.
Having regard to Johns Lyng Group's size, it seems that its liquid assets are well balanced with its total liabilities. So while it's hard to imagine that the AU$1.03b company is struggling for cash, we still think it's worth monitoring its balance sheet. While it does have liabilities worth noting, Johns Lyng Group also has more cash than debt, so we're pretty confident it can manage its debt safely.
Fortunately, Johns Lyng Group grew its EBIT by 3.5% in the last year, making that debt load look even more manageable. The balance sheet is clearly the area to focus on when you are analysing debt. But it is future earnings, more than anything, that will determine Johns Lyng Group's ability to maintain a healthy balance sheet going forward. So if you want to see what the professionals think, you might find this free report on analyst profit forecasts to be interesting.
Finally, a company can only pay off debt with cold hard cash, not accounting profits. Johns Lyng Group may have net cash on the balance sheet, but it is still interesting to look at how well the business converts its earnings before interest and tax (EBIT) to free cash flow, because that will influence both its need for, and its capacity to manage debt. Over the most recent three years, Johns Lyng Group recorded free cash flow worth 63% of its EBIT, which is around normal, given free cash flow excludes interest and tax. This cold hard cash means it can reduce its debt when it wants to.
Summing Up
While it is always sensible to look at a company's total liabilities, it is very reassuring that Johns Lyng Group has AU$39.5m in net cash. So is Johns Lyng Group's debt a risk? It doesn't seem so to us. When analysing debt levels, the balance sheet is the obvious place to start. But ultimately, every company can contain risks that exist outside of the balance sheet. Be aware that Johns Lyng Group is showing 1 warning sign in our investment analysis , you should know about...
When all is said and done, sometimes its easier to focus on companies that don't even need debt. Readers can access a list of growth stocks with zero net debt 100% free, right now.
New: Manage All Your Stock Portfolios in One Place
We've created the ultimate portfolio companion for stock investors, and it's free.
• Connect an unlimited number of Portfolios and see your total in one currency
• Be alerted to new Warning Signs or Risks via email or mobile
• Track the Fair Value of your stocks
Have feedback on this article? Concerned about the content? Get in touch with us directly. Alternatively, email editorial-team (at) simplywallst.com.
This article by Simply Wall St is general in nature. We provide commentary based on historical data and analyst forecasts only using an unbiased methodology and our articles are not intended to be financial advice. It does not constitute a recommendation to buy or sell any stock, and does not take account of your objectives, or your financial situation. We aim to bring you long-term focused analysis driven by fundamental data. Note that our analysis may not factor in the latest price-sensitive company announcements or qualitative material. Simply Wall St has no position in any stocks mentioned.
About ASX:JLG
Johns Lyng Group
Provides integrated building services in Australia, New Zealand, and the United States.
Excellent balance sheet and slightly overvalued.
Similar Companies
Market Insights

Advertisement
Community Narratives
Finding The True Value Of A Logistics Powerhouse
Fair Value US$95.21|7.5% undervalued
NV
Community Contributor
Paradigm Biopharmaceuticals Will Lead Osteoarthritis Treatment with Zilosul's FDA Success
Fair Value AU$5.50|91.8% undervalued
AM
Community Contributor
Barrick Mining (ABX:CA): A Gold Hedge against a U.S. Shutdown
Fair Value CA$60.00|26.4% undervalued
GM
Community Contributor