- Australia
- /
- Water Utilities
- /
- ASX:FLC
Fluence Corporation Limited (ASX:FLC) Soars 53% But It's A Story Of Risk Vs Reward

Those holding Fluence Corporation Limited (ASX:FLC) shares would be relieved that the share price has rebounded 53% in the last thirty days, but it needs to keep going to repair the recent damage it has caused to investor portfolios. Not all shareholders will be feeling jubilant, since the share price is still down a very disappointing 40% in the last twelve months.
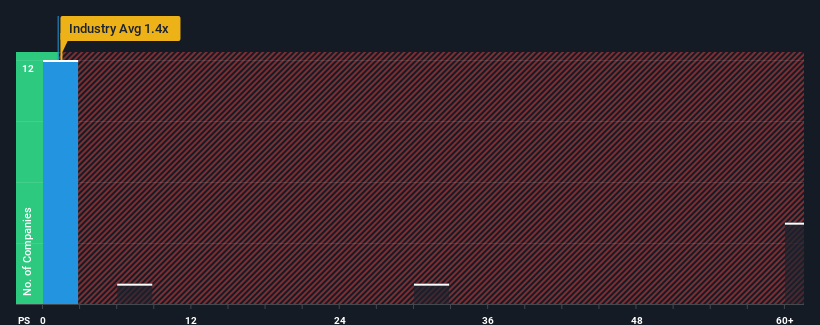
Although its price has surged higher, Fluence may still be sending buy signals at present with its price-to-sales (or "P/S") ratio of 1.2x, considering almost half of all companies in the Machinery industry in Australia have P/S ratios greater than 2.4x and even P/S higher than 39x aren't out of the ordinary. Although, it's not wise to just take the P/S at face value as there may be an explanation why it's limited.
Check out our latest analysis for Fluence
How Has Fluence Performed Recently?
For instance, Fluence's receding revenue in recent times would have to be some food for thought. One possibility is that the P/S is low because investors think the company won't do enough to avoid underperforming the broader industry in the near future. However, if this doesn't eventuate then existing shareholders may be feeling optimistic about the future direction of the share price.
We don't have analyst forecasts, but you can see how recent trends are setting up the company for the future by checking out our free report on Fluence's earnings, revenue and cash flow.Do Revenue Forecasts Match The Low P/S Ratio?
There's an inherent assumption that a company should underperform the industry for P/S ratios like Fluence's to be considered reasonable.
Taking a look back first, the company's revenue growth last year wasn't something to get excited about as it posted a disappointing decline of 37%. As a result, revenue from three years ago have also fallen 4.4% overall. Therefore, it's fair to say the revenue growth recently has been undesirable for the company.
Comparing that to the industry, which is predicted to shrink 29% in the next 12 months, the company's downward momentum is still superior based on recent medium-term annualised revenue results.
In light of this, the fact Fluence's P/S sits below the majority of other companies is peculiar but certainly not shocking. There's no guarantee the P/S has found a floor yet with recent revenue going backwards, despite the industry heading down even harder. Even just maintaining these prices will be difficult to achieve as recent revenue trends are already weighing down the shares excessively.
The Final Word
Fluence's stock price has surged recently, but its but its P/S still remains modest. Using the price-to-sales ratio alone to determine if you should sell your stock isn't sensible, however it can be a practical guide to the company's future prospects.
Our examination of Fluence revealed its narrower three-year contraction in revenue isn't contributing to its P/S anywhere near as much as we would have predicted, given the industry is set to shrink even more. There could be some major unobserved threats to revenue preventing the P/S ratio from matching this comparatively more attractive revenue performance. We'd hazard a guess that some investors are concerned about the company's revenue performance tailing off amidst these tough industry conditions. At least the risk of a price drop looks to be subdued, but investors seem to think future revenue could see a lot of volatility.
And what about other risks? Every company has them, and we've spotted 3 warning signs for Fluence (of which 2 shouldn't be ignored!) you should know about.
If you're unsure about the strength of Fluence's business, why not explore our interactive list of stocks with solid business fundamentals for some other companies you may have missed.
The New Payments ETF Is Live on NASDAQ:
Money is moving to real-time rails, and a newly listed ETF now gives investors direct exposure. Fast settlement. Institutional custody. Simple access.
Explore how this launch could reshape portfolios
Sponsored ContentNew: AI Stock Screener & Alerts
Our new AI Stock Screener scans the market every day to uncover opportunities.
• Dividend Powerhouses (3%+ Yield)
• Undervalued Small Caps with Insider Buying
• High growth Tech and AI Companies
Or build your own from over 50 metrics.
Have feedback on this article? Concerned about the content? Get in touch with us directly. Alternatively, email editorial-team (at) simplywallst.com.
This article by Simply Wall St is general in nature. We provide commentary based on historical data and analyst forecasts only using an unbiased methodology and our articles are not intended to be financial advice. It does not constitute a recommendation to buy or sell any stock, and does not take account of your objectives, or your financial situation. We aim to bring you long-term focused analysis driven by fundamental data. Note that our analysis may not factor in the latest price-sensitive company announcements or qualitative material. Simply Wall St has no position in any stocks mentioned.
About ASX:FLC
Fluence
Provides smart water and wastewater treatment solutions for the municipal, commercial, and industrial markets worldwide.
Good value with reasonable growth potential.
Similar Companies
Market Insights

Weekly Picks

Early mover in a fast growing industry. Likely to experience share price volatility as they scale


A case for CA$31.80 (undiluted), aka 8,616% upside from CA$0.37 (an 86 bagger!).


Moderation and Stabilisation: HOLD: Fair Price based on a 4-year Cycle is $12.08
Recently Updated Narratives


Title: Market Sentiment Is Dead Wrong — Here's Why PSEC Deserves a Second Look


An amazing opportunity to potentially get a 100 bagger

Amazon: Why the World’s Biggest Platform Still Runs on Invisible Economics
Popular Narratives


Crazy Undervalued 42 Baggers Silver Play (Active & Running Mine)


MicroVision will explode future revenue by 380.37% with a vision towards success


NVDA: Expanding AI Demand Will Drive Major Data Center Investments Through 2026
Trending Discussion
