Westpac Banking's (ASX:WBC) earnings growth rate lags the 35% return delivered to shareholders

If you want to compound wealth in the stock market, you can do so by buying an index fund. But one can do better than that by picking better than average stocks (as part of a diversified portfolio). To wit, the Westpac Banking Corporation (ASX:WBC) share price is 27% higher than it was a year ago, much better than the market return of around 5.2% (not including dividends) in the same period. So that should have shareholders smiling. However, the stock hasn't done so well in the longer term, with the stock only up 7.2% in three years.
Although Westpac Banking has shed AU$3.3b from its market cap this week, let's take a look at its longer term fundamental trends and see if they've driven returns.
See our latest analysis for Westpac Banking
To quote Buffett, 'Ships will sail around the world but the Flat Earth Society will flourish. There will continue to be wide discrepancies between price and value in the marketplace...' One imperfect but simple way to consider how the market perception of a company has shifted is to compare the change in the earnings per share (EPS) with the share price movement.
During the last year Westpac Banking grew its earnings per share (EPS) by 1.9%. This EPS growth is significantly lower than the 27% increase in the share price. This indicates that the market is now more optimistic about the stock.
The company's earnings per share (over time) is depicted in the image below (click to see the exact numbers).
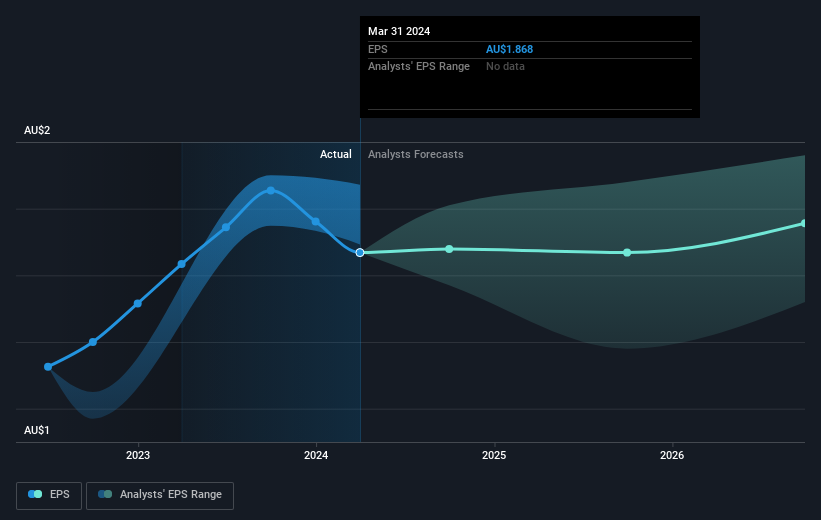
Before buying or selling a stock, we always recommend a close examination of historic growth trends, available here.
What About Dividends?
As well as measuring the share price return, investors should also consider the total shareholder return (TSR). Whereas the share price return only reflects the change in the share price, the TSR includes the value of dividends (assuming they were reinvested) and the benefit of any discounted capital raising or spin-off. It's fair to say that the TSR gives a more complete picture for stocks that pay a dividend. As it happens, Westpac Banking's TSR for the last 1 year was 35%, which exceeds the share price return mentioned earlier. And there's no prize for guessing that the dividend payments largely explain the divergence!
A Different Perspective
It's nice to see that Westpac Banking shareholders have received a total shareholder return of 35% over the last year. That's including the dividend. That's better than the annualised return of 5% over half a decade, implying that the company is doing better recently. Given the share price momentum remains strong, it might be worth taking a closer look at the stock, lest you miss an opportunity. While it is well worth considering the different impacts that market conditions can have on the share price, there are other factors that are even more important. Even so, be aware that Westpac Banking is showing 1 warning sign in our investment analysis , you should know about...
If you are like me, then you will not want to miss this free list of undervalued small caps that insiders are buying.
Please note, the market returns quoted in this article reflect the market weighted average returns of stocks that currently trade on Australian exchanges.
Valuation is complex, but we're here to simplify it.
Discover if Westpac Banking might be undervalued or overvalued with our detailed analysis, featuring fair value estimates, potential risks, dividends, insider trades, and its financial condition.
Access Free AnalysisHave feedback on this article? Concerned about the content? Get in touch with us directly. Alternatively, email editorial-team (at) simplywallst.com.
This article by Simply Wall St is general in nature. We provide commentary based on historical data and analyst forecasts only using an unbiased methodology and our articles are not intended to be financial advice. It does not constitute a recommendation to buy or sell any stock, and does not take account of your objectives, or your financial situation. We aim to bring you long-term focused analysis driven by fundamental data. Note that our analysis may not factor in the latest price-sensitive company announcements or qualitative material. Simply Wall St has no position in any stocks mentioned.
About ASX:WBC
Westpac Banking
Provides banking and other financial services in Australia, New Zealand, the Pacific Islands, Asia, the Americas, and Europe.
Excellent balance sheet second-rate dividend payer.
Market Insights

Community Narratives


