Those who invested in ANZ Group Holdings (ASX:ANZ) a year ago are up 30%


If you want to compound wealth in the stock market, you can do so by buying an index fund. But one can do better than that by picking better than average stocks (as part of a diversified portfolio). To wit, the ANZ Group Holdings Limited (ASX:ANZ) share price is 22% higher than it was a year ago, much better than the market return of around 10% (not including dividends) in the same period. That's a solid performance by our standards! However, the stock hasn't done so well in the longer term, with the stock only up 8.7% in three years.
Let's take a look at the underlying fundamentals over the longer term, and see if they've been consistent with shareholders returns.
View our latest analysis for ANZ Group Holdings
While the efficient markets hypothesis continues to be taught by some, it has been proven that markets are over-reactive dynamic systems, and investors are not always rational. By comparing earnings per share (EPS) and share price changes over time, we can get a feel for how investor attitudes to a company have morphed over time.
Over the last twelve months, ANZ Group Holdings actually shrank its EPS by 5.5%.
Given the share price gain, we doubt the market is measuring progress with EPS. Indeed, when EPS is declining but the share price is up, it often means the market is considering other factors.
We haven't seen ANZ Group Holdings increase dividend payments yet, so the yield probably hasn't helped drive the share higher. And at a glance the revenue growth does not impress, though a closer look at revenue trends may reveal some form of insight.
The graphic below depicts how earnings and revenue have changed over time (unveil the exact values by clicking on the image).
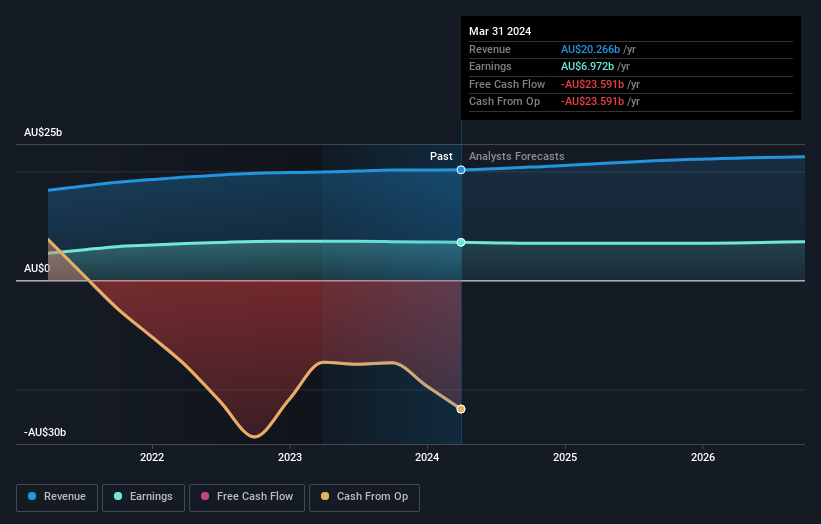
ANZ Group Holdings is a well known stock, with plenty of analyst coverage, suggesting some visibility into future growth. So it makes a lot of sense to check out what analysts think ANZ Group Holdings will earn in the future (free analyst consensus estimates)
What About Dividends?
As well as measuring the share price return, investors should also consider the total shareholder return (TSR). The TSR is a return calculation that accounts for the value of cash dividends (assuming that any dividend received was reinvested) and the calculated value of any discounted capital raisings and spin-offs. So for companies that pay a generous dividend, the TSR is often a lot higher than the share price return. In the case of ANZ Group Holdings, it has a TSR of 30% for the last 1 year. That exceeds its share price return that we previously mentioned. And there's no prize for guessing that the dividend payments largely explain the divergence!
A Different Perspective
We're pleased to report that ANZ Group Holdings shareholders have received a total shareholder return of 30% over one year. That's including the dividend. That gain is better than the annual TSR over five years, which is 8%. Therefore it seems like sentiment around the company has been positive lately. Given the share price momentum remains strong, it might be worth taking a closer look at the stock, lest you miss an opportunity. I find it very interesting to look at share price over the long term as a proxy for business performance. But to truly gain insight, we need to consider other information, too. Case in point: We've spotted 1 warning sign for ANZ Group Holdings you should be aware of.
If you would prefer to check out another company -- one with potentially superior financials -- then do not miss this free list of companies that have proven they can grow earnings.
Please note, the market returns quoted in this article reflect the market weighted average returns of stocks that currently trade on Australian exchanges.
New: Manage All Your Stock Portfolios in One Place
We've created the ultimate portfolio companion for stock investors, and it's free.
• Connect an unlimited number of Portfolios and see your total in one currency
• Be alerted to new Warning Signs or Risks via email or mobile
• Track the Fair Value of your stocks
Have feedback on this article? Concerned about the content? Get in touch with us directly. Alternatively, email editorial-team (at) simplywallst.com.
This article by Simply Wall St is general in nature. We provide commentary based on historical data and analyst forecasts only using an unbiased methodology and our articles are not intended to be financial advice. It does not constitute a recommendation to buy or sell any stock, and does not take account of your objectives, or your financial situation. We aim to bring you long-term focused analysis driven by fundamental data. Note that our analysis may not factor in the latest price-sensitive company announcements or qualitative material. Simply Wall St has no position in any stocks mentioned.
About ASX:ANZ
ANZ Group Holdings
Provides various banking and financial products and services to retail, individuals and business customers in Australia and internationally.
Flawless balance sheet and good value.
Similar Companies
Market Insights

Community Narratives
