
Advertisement
- Australia
- /
- Auto Components
- /
- ASX:ARB
Is Weakness In ARB Corporation Limited (ASX:ARB) Stock A Sign That The Market Could be Wrong Given Its Strong Financial Prospects?
With its stock down 7.2% over the past three months, it is easy to disregard ARB (ASX:ARB). However, stock prices are usually driven by a company’s financial performance over the long term, which in this case looks quite promising. Specifically, we decided to study ARB's ROE in this article.
Return on equity or ROE is a key measure used to assess how efficiently a company's management is utilizing the company's capital. Put another way, it reveals the company's success at turning shareholder investments into profits.
Check out our latest analysis for ARB
How Do You Calculate Return On Equity?
ROE can be calculated by using the formula:
Return on Equity = Net Profit (from continuing operations) ÷ Shareholders' Equity
So, based on the above formula, the ROE for ARB is:
15% = AU$92m ÷ AU$636m (Based on the trailing twelve months to December 2023).
The 'return' is the amount earned after tax over the last twelve months. So, this means that for every A$1 of its shareholder's investments, the company generates a profit of A$0.15.
What Has ROE Got To Do With Earnings Growth?
So far, we've learned that ROE is a measure of a company's profitability. Depending on how much of these profits the company reinvests or "retains", and how effectively it does so, we are then able to assess a company’s earnings growth potential. Assuming everything else remains unchanged, the higher the ROE and profit retention, the higher the growth rate of a company compared to companies that don't necessarily bear these characteristics.
A Side By Side comparison of ARB's Earnings Growth And 15% ROE
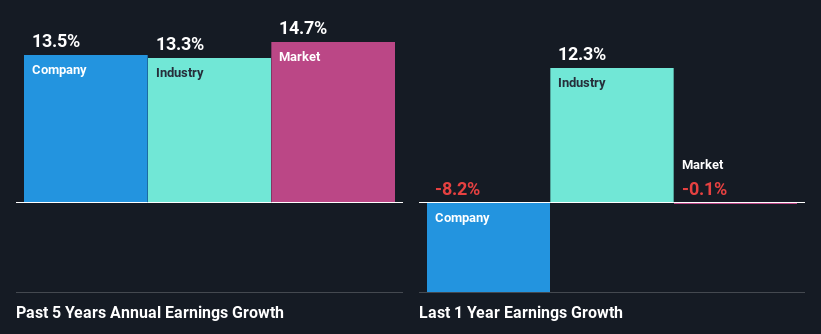
At first glance, ARB seems to have a decent ROE. Further, the company's ROE compares quite favorably to the industry average of 12%. This probably laid the ground for ARB's moderate 14% net income growth seen over the past five years.
Next, on comparing ARB's net income growth with the industry, we found that the company's reported growth is similar to the industry average growth rate of 13% over the last few years.
Earnings growth is a huge factor in stock valuation. It’s important for an investor to know whether the market has priced in the company's expected earnings growth (or decline). This then helps them determine if the stock is placed for a bright or bleak future. One good indicator of expected earnings growth is the P/E ratio which determines the price the market is willing to pay for a stock based on its earnings prospects. So, you may want to check if ARB is trading on a high P/E or a low P/E, relative to its industry.
Is ARB Using Its Retained Earnings Effectively?
ARB has a healthy combination of a moderate three-year median payout ratio of 50% (or a retention ratio of 50%) and a respectable amount of growth in earnings as we saw above, meaning that the company has been making efficient use of its profits.
Besides, ARB has been paying dividends for at least ten years or more. This shows that the company is committed to sharing profits with its shareholders. Upon studying the latest analysts' consensus data, we found that the company is expected to keep paying out approximately 54% of its profits over the next three years. As a result, ARB's ROE is not expected to change by much either, which we inferred from the analyst estimate of 16% for future ROE.
Conclusion
In total, we are pretty happy with ARB's performance. Specifically, we like that the company is reinvesting a huge chunk of its profits at a high rate of return. This of course has caused the company to see substantial growth in its earnings. Having said that, the company's earnings growth is expected to slow down, as forecasted in the current analyst estimates. To know more about the latest analysts predictions for the company, check out this visualization of analyst forecasts for the company.
New: Manage All Your Stock Portfolios in One Place
We've created the ultimate portfolio companion for stock investors, and it's free.
• Connect an unlimited number of Portfolios and see your total in one currency
• Be alerted to new Warning Signs or Risks via email or mobile
• Track the Fair Value of your stocks
Have feedback on this article? Concerned about the content? Get in touch with us directly. Alternatively, email editorial-team (at) simplywallst.com.
This article by Simply Wall St is general in nature. We provide commentary based on historical data and analyst forecasts only using an unbiased methodology and our articles are not intended to be financial advice. It does not constitute a recommendation to buy or sell any stock, and does not take account of your objectives, or your financial situation. We aim to bring you long-term focused analysis driven by fundamental data. Note that our analysis may not factor in the latest price-sensitive company announcements or qualitative material. Simply Wall St has no position in any stocks mentioned.
About ASX:ARB
ARB
Engages in the design, manufacture, distribution, and sale of motor vehicle accessories and light metal engineering works.
Flawless balance sheet average dividend payer.
Similar Companies
Market Insights

Advertisement
Community Narratives
MINISO's fair value is projected at 26.69 with an anticipated PE ratio shift of 20x
Fair Value US$24.03|11.4% undervalued
BE
Community Contributor
Procter & Gamble: A Dividend Giant Facing Slowing Growth
Fair Value US$119.81|23.5% overvalued
AN
Community Contributor
Eli Lilly's Future Growth Driven by Tirzepatide and Favorable Market Conditions
Fair Value US$1.19k|14.0% undervalued
EA
Community Contributor