Advertisement
- Austria
- /
- Basic Materials
- /
- WBAG:WIE
Should Investors Rethink Wienerberger After Recent 3% Share Price Drop?

Simply Wall St
Reviewed by Bailey Pemberton
If you’ve been weighing what to do with your Wienerberger shares lately, you’re not alone. The stock has been on a bit of a rollercoaster, which might leave even seasoned investors second-guessing their next move. Over the past week, Wienerberger shares slipped by 3.2%, extending a one-month pullback to 8.6%. From the start of the year, performance is just shy of flat at -0.8%, and the past year has seen a relatively modest decline of 2.4%. Step back and the longer-term view tells a different story, with the stock rising about 27% over both the past three and five years. Recent moves seem to reflect mixed investor confidence, possibly influenced by broader market sentiment and sector trends rather than developments unique to Wienerberger itself.
But here is what counts for value-minded investors: based on our comprehensive valuation checks, Wienerberger notched a perfect 6 out of 6. This offers compelling evidence the stock could be undervalued across the board. So how does this score hold up against the numbers, and what can the main valuation models really reveal? Let’s walk through the key approaches together, and stick around because we will finish with an even more insightful angle for truly understanding what Wienerberger’s worth.
Why Wienerberger is lagging behind its peers
Approach 1: Wienerberger Discounted Cash Flow (DCF) Analysis
The Discounted Cash Flow (DCF) model aims to estimate a company's intrinsic value by projecting its future cash flows and discounting them to today's terms. For Wienerberger, this approach starts with its latest twelve-month Free Cash Flow, which came in at €279.8 million. Analyst consensus expects this figure to steadily rise, with Free Cash Flow projected to hit €539.9 million by 2029. Beyond those analyst forecasts, future values have been extrapolated using modest growth assumptions, following Simply Wall St's methodology.
All of these cash flows are measured in millions of euros, and the two-stage DCF model discounts each projection to account for the time value of money. The result is an estimated fair value of €73.58 per share. When compared to today's price, the model suggests Wienerberger is trading at a 64.4% discount to its intrinsic value.
This sizeable gap indicates the shares could be significantly undervalued according to the cash flow projections.
Result: UNDERVALUED

Our Discounted Cash Flow (DCF) analysis suggests Wienerberger is undervalued by 64.4%. Track this in your watchlist or portfolio, or discover more undervalued stocks.
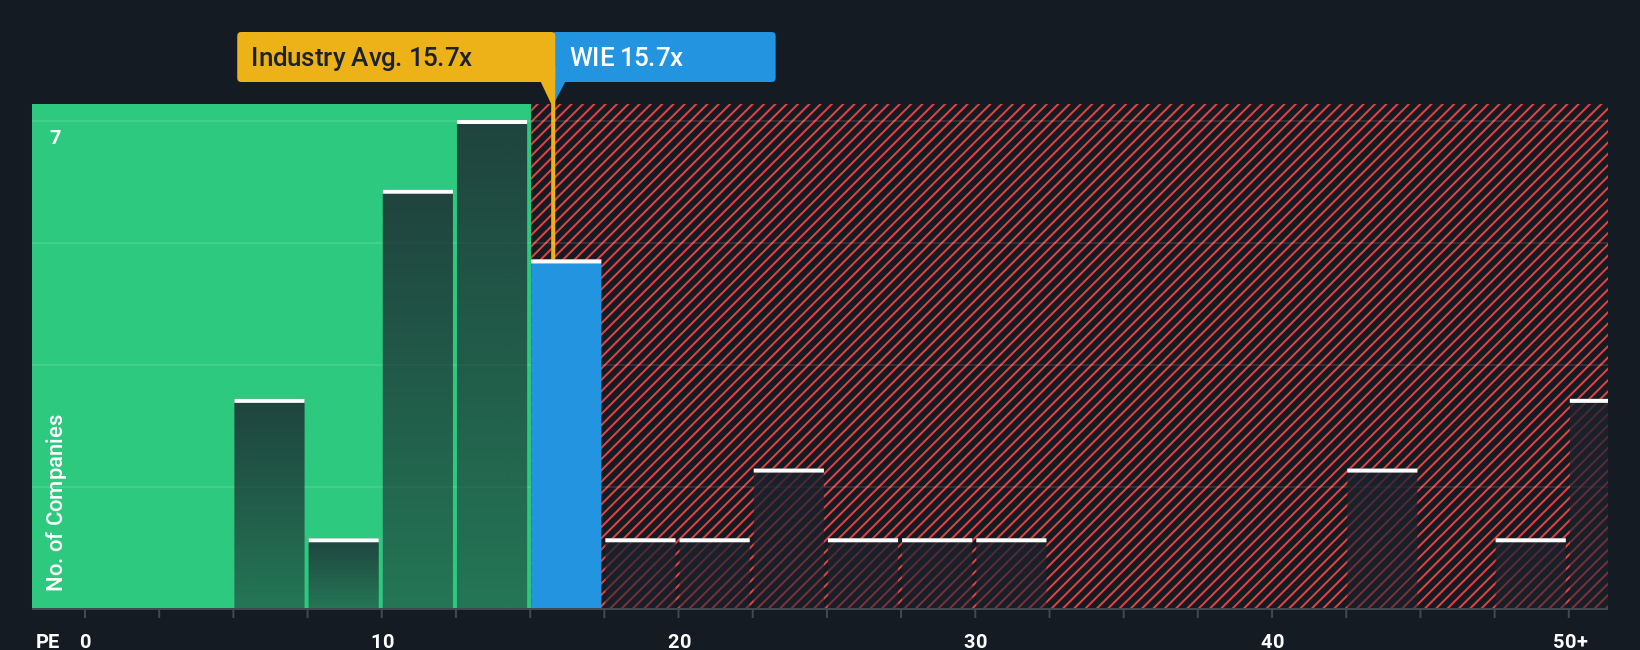
Approach 2: Wienerberger Price vs Earnings
The Price-to-Earnings (PE) ratio is a time-tested tool for valuing profitable companies like Wienerberger because it gives investors a clear sense of how much they are paying for each euro of earnings today. Generally, future growth potential and the degree of business risk drive what is considered a "fair" PE ratio. Higher quality growth justifies a higher multiple, while more risk or stagnant profits push it lower.
Currently, Wienerberger trades at a PE ratio of 15.3x. This is almost identical to the Basic Materials industry average of 15.3x, but it sits well below the average PE ratio of its peers, which is notably higher at 26.3x. While these figures offer a helpful reference, they do not tell the full story.
Simply Wall St uses its proprietary "Fair Ratio" to judge value more comprehensively. This metric incorporates not just growth and risks, but also margins, industry context, and the company's market cap, leading to a more nuanced and actionable benchmark. For Wienerberger, the Fair Ratio comes out at 23.1x. Based on company-specific characteristics, investors might reasonably expect to pay more for each euro of earnings versus the company's current valuation.
Comparing the Fair Ratio with the current PE, Wienerberger’s stock looks undervalued on this measure, suggesting a potential opportunity for investors who think the market may be underappreciating its strengths and prospects.
Result: UNDERVALUED
PE ratios tell one story, but what if the real opportunity lies elsewhere? Discover companies where insiders are betting big on explosive growth.
Upgrade Your Decision Making: Choose your Wienerberger Narrative
Earlier we mentioned there is an even better way to understand valuation. Let's introduce you to Narratives. A Narrative is your personal lens on a company; it is where you attach your story, assumptions, and expectations about Wienerberger’s future, such as potential revenue, profit margins, or business risks, and connect these directly to a financial forecast and a Fair Value estimate.
This approach goes beyond simple ratios and gives you a structured way to test your perspective against the latest data. Narratives are available on Simply Wall St's Community page and are used by millions of investors to easily build, compare, and discuss investment stories. They update automatically as new company updates or news arrive, making them a dynamic and truly actionable resource.
By comparing the Fair Value derived from your Narrative with the current share price, you can quickly decide whether you think now is a good time to buy, hold, or sell. For example, some investors’ most optimistic Narratives estimate a Fair Value as high as €40 per share, while others take a more cautious view and put it closer to €33. This illustrates just how flexible and insightful this approach can be.
Do you think there's more to the story for Wienerberger? Create your own Narrative to let the Community know!

This article by Simply Wall St is general in nature. We provide commentary based on historical data and analyst forecasts only using an unbiased methodology and our articles are not intended to be financial advice. It does not constitute a recommendation to buy or sell any stock, and does not take account of your objectives, or your financial situation. We aim to bring you long-term focused analysis driven by fundamental data. Note that our analysis may not factor in the latest price-sensitive company announcements or qualitative material. Simply Wall St has no position in any stocks mentioned.
Valuation is complex, but we're here to simplify it.
Discover if Wienerberger might be undervalued or overvalued with our detailed analysis, featuring fair value estimates, potential risks, dividends, insider trades, and its financial condition.
Access Free AnalysisHave feedback on this article? Concerned about the content? Get in touch with us directly. Alternatively, email editorial-team@simplywallst.com
About WBAG:WIE
Wienerberger
Produces and sells clay blocks, facing bricks, roof tiles, and pavers in Europe West, Europe East, and North America.
Established dividend payer and good value.
Similar Companies
Market Insights

Advertisement
Weekly Picks
RO


RockeTeller on Santacruz Silver Mining ·
Crazy Undervalued 42 Baggers Silver Play (Active & Running Mine)
Fair Value:CA$8696.7% undervalued
53 followersusers have followed this narrative
6 commentsusers have commented on this narrative
16 likesusers have liked this narrative
RO


Robbo on Fiducian Group ·
Fiducian: Compliance Clouds or Value Opportunity?
Fair Value:AU$122.0% undervalued
9 followersusers have followed this narrative
0 commentsusers have commented on this narrative
0 likesusers have liked this narrative
WO

woodworthfund on Willamette Valley Vineyards ·
Willamette Valley Vineyards (WVVI): Not-So-Great Value
Fair Value:US$242.5% overvalued
10 followersusers have followed this narrative
0 commentsusers have commented on this narrative
1 likeusers have liked this narrative
Recently Updated Narratives
MO


mo7md on ADNOC Gas ·
ADNOC Gas future shines with a 21.4% revenue surge
Fair Value:د.إ3.728.9% undervalued
2 followersusers have followed this narrative
0 commentsusers have commented on this narrative
0 likesusers have liked this narrative
IN

IncomeAssets on Pulse Seismic ·
Watch Pulse Seismic Outperform with 13.6% Revenue Growth in the Coming Years
Fair Value:CA$4.4727.3% undervalued
4 followersusers have followed this narrative
0 commentsusers have commented on this narrative
0 likesusers have liked this narrative
VL

Vladislav on Galleon Gold ·
Significantly undervalued gold explorer in Timmins, finally getting traction
Fair Value:CA$481.5% undervalued
7 followersusers have followed this narrative
0 commentsusers have commented on this narrative
0 likesusers have liked this narrative
Popular Narratives
TH


TheWallstreetKing on MicroVision ·
MicroVision will explode future revenue by 380.37% with a vision towards success
Fair Value:US$6098.5% undervalued
116 followersusers have followed this narrative
11 commentsusers have commented on this narrative
22 likesusers have liked this narrative
AN


AnalystConsensusTarget on NVIDIA ·
NVDA: Expanding AI Demand Will Drive Major Data Center Investments Through 2026
Fair Value:US$250.3927.2% undervalued
957 followersusers have followed this narrative
6 commentsusers have commented on this narrative
25 likesusers have liked this narrative
RO
RockeTeller on Santacruz Silver Mining ·
Crazy Undervalued 42 Baggers Silver Play (Active & Running Mine)
Fair Value:CA$8696.7% undervalued
53 followersusers have followed this narrative
6 commentsusers have commented on this narrative
16 likesusers have liked this narrative

