- Austria
- /
- Energy Services
- /
- WBAG:SBO
A Look At The Intrinsic Value Of Schoeller-Bleckmann Oilfield Equipment Aktiengesellschaft (VIE:SBO)


Key Insights
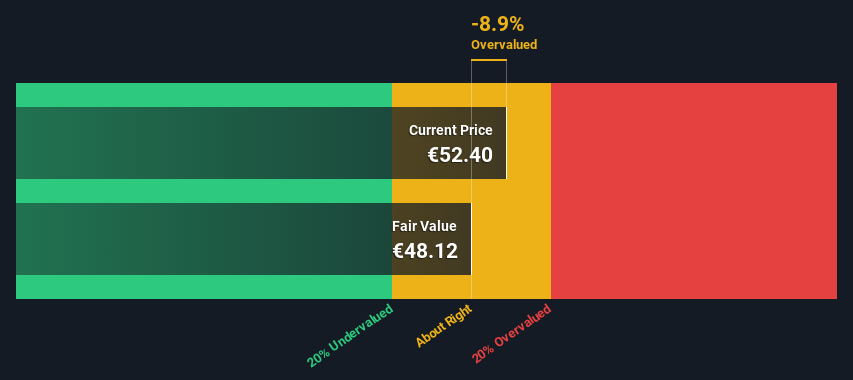
- Using the 2 Stage Free Cash Flow to Equity, Schoeller-Bleckmann Oilfield Equipment fair value estimate is €48.12
- Current share price of €52.40 suggests Schoeller-Bleckmann Oilfield Equipment is potentially trading close to its fair value
- Analyst price target for SBO is €84.72, which is 76% above our fair value estimate
Today we will run through one way of estimating the intrinsic value of Schoeller-Bleckmann Oilfield Equipment Aktiengesellschaft (VIE:SBO) by projecting its future cash flows and then discounting them to today's value. The Discounted Cash Flow (DCF) model is the tool we will apply to do this. Believe it or not, it's not too difficult to follow, as you'll see from our example!
Companies can be valued in a lot of ways, so we would point out that a DCF is not perfect for every situation. Anyone interested in learning a bit more about intrinsic value should have a read of the Simply Wall St analysis model.
View our latest analysis for Schoeller-Bleckmann Oilfield Equipment
Crunching The Numbers
We're using the 2-stage growth model, which simply means we take in account two stages of company's growth. In the initial period the company may have a higher growth rate and the second stage is usually assumed to have a stable growth rate. To start off with, we need to estimate the next ten years of cash flows. Where possible we use analyst estimates, but when these aren't available we extrapolate the previous free cash flow (FCF) from the last estimate or reported value. We assume companies with shrinking free cash flow will slow their rate of shrinkage, and that companies with growing free cash flow will see their growth rate slow, over this period. We do this to reflect that growth tends to slow more in the early years than it does in later years.
Generally we assume that a dollar today is more valuable than a dollar in the future, so we discount the value of these future cash flows to their estimated value in today's dollars:
10-year free cash flow (FCF) estimate
| 2024 | 2025 | 2026 | 2027 | 2028 | 2029 | 2030 | 2031 | 2032 | 2033 | |
| Levered FCF (€, Millions) | €68.1m | €83.8m | €66.0m | €72.8m | €72.7m | €72.8m | €73.0m | €73.2m | €73.6m | €74.0m |
| Growth Rate Estimate Source | Analyst x3 | Analyst x3 | Analyst x1 | Analyst x1 | Est @ -0.16% | Est @ 0.10% | Est @ 0.27% | Est @ 0.40% | Est @ 0.49% | Est @ 0.55% |
| Present Value (€, Millions) Discounted @ 10.0% | €61.9 | €69.3 | €49.6 | €49.7 | €45.1 | €41.1 | €37.4 | €34.2 | €31.2 | €28.5 |
("Est" = FCF growth rate estimated by Simply Wall St)
Present Value of 10-year Cash Flow (PVCF) = €448m
The second stage is also known as Terminal Value, this is the business's cash flow after the first stage. For a number of reasons a very conservative growth rate is used that cannot exceed that of a country's GDP growth. In this case we have used the 5-year average of the 10-year government bond yield (0.7%) to estimate future growth. In the same way as with the 10-year 'growth' period, we discount future cash flows to today's value, using a cost of equity of 10.0%.
Terminal Value (TV)= FCF2033 × (1 + g) ÷ (r – g) = €74m× (1 + 0.7%) ÷ (10.0%– 0.7%) = €801m
Present Value of Terminal Value (PVTV)= TV / (1 + r)10= €801m÷ ( 1 + 10.0%)10= €309m
The total value, or equity value, is then the sum of the present value of the future cash flows, which in this case is €757m. In the final step we divide the equity value by the number of shares outstanding. Compared to the current share price of €52.4, the company appears around fair value at the time of writing. Valuations are imprecise instruments though, rather like a telescope - move a few degrees and end up in a different galaxy. Do keep this in mind.
The Assumptions
The calculation above is very dependent on two assumptions. The first is the discount rate and the other is the cash flows. You don't have to agree with these inputs, I recommend redoing the calculations yourself and playing with them. The DCF also does not consider the possible cyclicality of an industry, or a company's future capital requirements, so it does not give a full picture of a company's potential performance. Given that we are looking at Schoeller-Bleckmann Oilfield Equipment as potential shareholders, the cost of equity is used as the discount rate, rather than the cost of capital (or weighted average cost of capital, WACC) which accounts for debt. In this calculation we've used 10.0%, which is based on a levered beta of 1.659. Beta is a measure of a stock's volatility, compared to the market as a whole. We get our beta from the industry average beta of globally comparable companies, with an imposed limit between 0.8 and 2.0, which is a reasonable range for a stable business.
SWOT Analysis for Schoeller-Bleckmann Oilfield Equipment
- Earnings growth over the past year exceeded the industry.
- Debt is not viewed as a risk.
- Dividends are covered by earnings and cash flows.
- Dividend is low compared to the top 25% of dividend payers in the Energy Services market.
- Expensive based on P/E ratio and estimated fair value.
- Annual revenue is forecast to grow faster than the Austrian market.
- Annual earnings are forecast to grow slower than the Austrian market.
Next Steps:
Valuation is only one side of the coin in terms of building your investment thesis, and it is only one of many factors that you need to assess for a company. The DCF model is not a perfect stock valuation tool. Preferably you'd apply different cases and assumptions and see how they would impact the company's valuation. For instance, if the terminal value growth rate is adjusted slightly, it can dramatically alter the overall result. For Schoeller-Bleckmann Oilfield Equipment, we've put together three further items you should assess:
- Risks: For example, we've discovered 2 warning signs for Schoeller-Bleckmann Oilfield Equipment that you should be aware of before investing here.
- Future Earnings: How does SBO's growth rate compare to its peers and the wider market? Dig deeper into the analyst consensus number for the upcoming years by interacting with our free analyst growth expectation chart.
- Other Solid Businesses: Low debt, high returns on equity and good past performance are fundamental to a strong business. Why not explore our interactive list of stocks with solid business fundamentals to see if there are other companies you may not have considered!
PS. The Simply Wall St app conducts a discounted cash flow valuation for every stock on the WBAG every day. If you want to find the calculation for other stocks just search here.
New: Manage All Your Stock Portfolios in One Place
We've created the ultimate portfolio companion for stock investors, and it's free.
• Connect an unlimited number of Portfolios and see your total in one currency
• Be alerted to new Warning Signs or Risks via email or mobile
• Track the Fair Value of your stocks
Have feedback on this article? Concerned about the content? Get in touch with us directly. Alternatively, email editorial-team (at) simplywallst.com.
This article by Simply Wall St is general in nature. We provide commentary based on historical data and analyst forecasts only using an unbiased methodology and our articles are not intended to be financial advice. It does not constitute a recommendation to buy or sell any stock, and does not take account of your objectives, or your financial situation. We aim to bring you long-term focused analysis driven by fundamental data. Note that our analysis may not factor in the latest price-sensitive company announcements or qualitative material. Simply Wall St has no position in any stocks mentioned.
About WBAG:SBO
Schoeller-Bleckmann Oilfield Equipment
Manufactures and sells steel products worldwide.
Excellent balance sheet established dividend payer.
Similar Companies
Market Insights

Community Narratives

