- Austria
- /
- Electrical
- /
- WBAG:CLEN
Lacklustre Performance Is Driving Cleen Energy AG's (VIE:CLEN) 36% Price Drop


To the annoyance of some shareholders, Cleen Energy AG (VIE:CLEN) shares are down a considerable 36% in the last month, which continues a horrid run for the company. The recent drop completes a disastrous twelve months for shareholders, who are sitting on a 78% loss during that time.
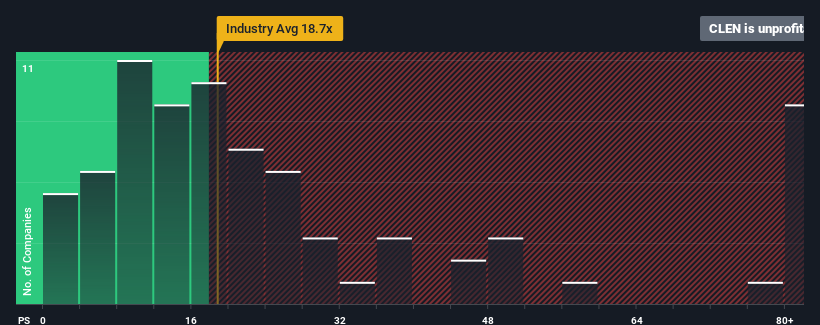
Although its price has dipped substantially, Cleen Energy may still be sending very bullish signals at the moment with its price-to-earnings (or "P/E") ratio of -1.7x, since almost half of all companies in Austria have P/E ratios greater than 12x and even P/E's higher than 24x are not unusual. However, the P/E might be quite low for a reason and it requires further investigation to determine if it's justified.
For example, consider that Cleen Energy's financial performance has been poor lately as its earnings have been in decline. One possibility is that the P/E is low because investors think the company won't do enough to avoid underperforming the broader market in the near future. However, if this doesn't eventuate then existing shareholders may be feeling optimistic about the future direction of the share price.
See our latest analysis for Cleen Energy
What Are Growth Metrics Telling Us About The Low P/E?
There's an inherent assumption that a company should far underperform the market for P/E ratios like Cleen Energy's to be considered reasonable.
Retrospectively, the last year delivered a frustrating 143% decrease to the company's bottom line. This has erased any of its gains during the last three years, with practically no change in EPS being achieved in total. Accordingly, shareholders probably wouldn't have been overly satisfied with the unstable medium-term growth rates.
Weighing that recent medium-term earnings trajectory against the broader market's one-year forecast for expansion of 2.5% shows it's noticeably less attractive on an annualised basis.
In light of this, it's understandable that Cleen Energy's P/E sits below the majority of other companies. It seems most investors are expecting to see the recent limited growth rates continue into the future and are only willing to pay a reduced amount for the stock.
What We Can Learn From Cleen Energy's P/E?
Having almost fallen off a cliff, Cleen Energy's share price has pulled its P/E way down as well. Using the price-to-earnings ratio alone to determine if you should sell your stock isn't sensible, however it can be a practical guide to the company's future prospects.
As we suspected, our examination of Cleen Energy revealed its three-year earnings trends are contributing to its low P/E, given they look worse than current market expectations. Right now shareholders are accepting the low P/E as they concede future earnings probably won't provide any pleasant surprises. Unless the recent medium-term conditions improve, they will continue to form a barrier for the share price around these levels.
Don't forget that there may be other risks. For instance, we've identified 6 warning signs for Cleen Energy (4 don't sit too well with us) you should be aware of.
Of course, you might also be able to find a better stock than Cleen Energy. So you may wish to see this free collection of other companies that have reasonable P/E ratios and have grown earnings strongly.
New: AI Stock Screener & Alerts
Our new AI Stock Screener scans the market every day to uncover opportunities.
• Dividend Powerhouses (3%+ Yield)
• Undervalued Small Caps with Insider Buying
• High growth Tech and AI Companies
Or build your own from over 50 metrics.
Have feedback on this article? Concerned about the content? Get in touch with us directly. Alternatively, email editorial-team (at) simplywallst.com.
This article by Simply Wall St is general in nature. We provide commentary based on historical data and analyst forecasts only using an unbiased methodology and our articles are not intended to be financial advice. It does not constitute a recommendation to buy or sell any stock, and does not take account of your objectives, or your financial situation. We aim to bring you long-term focused analysis driven by fundamental data. Note that our analysis may not factor in the latest price-sensitive company announcements or qualitative material. Simply Wall St has no position in any stocks mentioned.
About WBAG:CLEN
Cleen Energy
Engages in the provision of renewable technologies in German-speaking countries internationally.
Slight with weak fundamentals.

