- United Arab Emirates
- /
- Healthcare Services
- /
- ADX:BURJEEL
A Look At The Fair Value Of Burjeel Holdings PLC (ADX:BURJEEL)


Key Insights
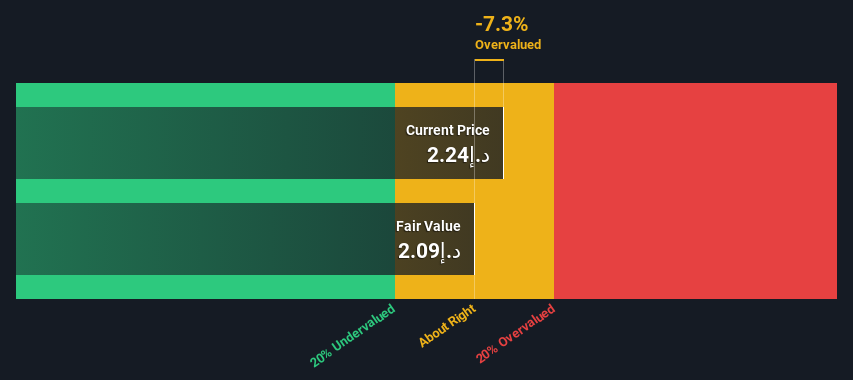
- The projected fair value for Burjeel Holdings is د.إ2.09 based on 2 Stage Free Cash Flow to Equity
- Current share price of د.إ2.24 suggests Burjeel Holdings is potentially trading close to its fair value
- Burjeel Holdings' peers seem to be trading at a higher premium to fair value based onthe industry average of -257%
Today we will run through one way of estimating the intrinsic value of Burjeel Holdings PLC (ADX:BURJEEL) by taking the forecast future cash flows of the company and discounting them back to today's value. Our analysis will employ the Discounted Cash Flow (DCF) model. Before you think you won't be able to understand it, just read on! It's actually much less complex than you'd imagine.
We generally believe that a company's value is the present value of all of the cash it will generate in the future. However, a DCF is just one valuation metric among many, and it is not without flaws. Anyone interested in learning a bit more about intrinsic value should have a read of the Simply Wall St analysis model.
See our latest analysis for Burjeel Holdings
The Model
We use what is known as a 2-stage model, which simply means we have two different periods of growth rates for the company's cash flows. Generally the first stage is higher growth, and the second stage is a lower growth phase. To start off with, we need to estimate the next ten years of cash flows. Where possible we use analyst estimates, but when these aren't available we extrapolate the previous free cash flow (FCF) from the last estimate or reported value. We assume companies with shrinking free cash flow will slow their rate of shrinkage, and that companies with growing free cash flow will see their growth rate slow, over this period. We do this to reflect that growth tends to slow more in the early years than it does in later years.
A DCF is all about the idea that a dollar in the future is less valuable than a dollar today, so we discount the value of these future cash flows to their estimated value in today's dollars:
10-year free cash flow (FCF) estimate
| 2024 | 2025 | 2026 | 2027 | 2028 | 2029 | 2030 | 2031 | 2032 | 2033 | |
| Levered FCF (AED, Millions) | د.إ561.0m | د.إ633.0m | د.إ699.3m | د.إ769.4m | د.إ844.1m | د.إ924.3m | د.إ1.01b | د.إ1.10b | د.إ1.21b | د.إ1.31b |
| Growth Rate Estimate Source | Analyst x1 | Analyst x1 | Est @ 10.47% | Est @ 10.02% | Est @ 9.71% | Est @ 9.50% | Est @ 9.34% | Est @ 9.24% | Est @ 9.16% | Est @ 9.11% |
| Present Value (AED, Millions) Discounted @ 15% | د.إ490 | د.إ483 | د.إ466 | د.إ447 | د.إ429 | د.إ410 | د.إ391 | د.إ373 | د.إ356 | د.إ339 |
("Est" = FCF growth rate estimated by Simply Wall St)
Present Value of 10-year Cash Flow (PVCF) = د.إ4.2b
We now need to calculate the Terminal Value, which accounts for all the future cash flows after this ten year period. The Gordon Growth formula is used to calculate Terminal Value at a future annual growth rate equal to the 5-year average of the 10-year government bond yield of 9.0%. We discount the terminal cash flows to today's value at a cost of equity of 15%.
Terminal Value (TV)= FCF2033 × (1 + g) ÷ (r – g) = د.إ1.3b× (1 + 9.0%) ÷ (15%– 9.0%) = د.إ26b
Present Value of Terminal Value (PVTV)= TV / (1 + r)10= د.إ26b÷ ( 1 + 15%)10= د.إ6.7b
The total value is the sum of cash flows for the next ten years plus the discounted terminal value, which results in the Total Equity Value, which in this case is د.إ11b. To get the intrinsic value per share, we divide this by the total number of shares outstanding. Relative to the current share price of د.إ2.2, the company appears around fair value at the time of writing. The assumptions in any calculation have a big impact on the valuation, so it is better to view this as a rough estimate, not precise down to the last cent.
Important Assumptions
We would point out that the most important inputs to a discounted cash flow are the discount rate and of course the actual cash flows. Part of investing is coming up with your own evaluation of a company's future performance, so try the calculation yourself and check your own assumptions. The DCF also does not consider the possible cyclicality of an industry, or a company's future capital requirements, so it does not give a full picture of a company's potential performance. Given that we are looking at Burjeel Holdings as potential shareholders, the cost of equity is used as the discount rate, rather than the cost of capital (or weighted average cost of capital, WACC) which accounts for debt. In this calculation we've used 15%, which is based on a levered beta of 0.814. Beta is a measure of a stock's volatility, compared to the market as a whole. We get our beta from the industry average beta of globally comparable companies, with an imposed limit between 0.8 and 2.0, which is a reasonable range for a stable business.
SWOT Analysis for Burjeel Holdings
- Earnings growth over the past year exceeded the industry.
- Debt is well covered by cash flow.
- Earnings growth over the past year is below its 5-year average.
- Interest payments on debt are not well covered.
- Current share price is above our estimate of fair value.
- Annual earnings are forecast to grow faster than the Emirian market.
- No apparent threats visible for BURJEEL.
Moving On:
Whilst important, the DCF calculation shouldn't be the only metric you look at when researching a company. DCF models are not the be-all and end-all of investment valuation. Rather it should be seen as a guide to "what assumptions need to be true for this stock to be under/overvalued?" For instance, if the terminal value growth rate is adjusted slightly, it can dramatically alter the overall result. For Burjeel Holdings, we've compiled three relevant items you should further examine:
- Risks: Take risks, for example - Burjeel Holdings has 1 warning sign we think you should be aware of.
- Future Earnings: How does BURJEEL's growth rate compare to its peers and the wider market? Dig deeper into the analyst consensus number for the upcoming years by interacting with our free analyst growth expectation chart.
- Other Solid Businesses: Low debt, high returns on equity and good past performance are fundamental to a strong business. Why not explore our interactive list of stocks with solid business fundamentals to see if there are other companies you may not have considered!
PS. Simply Wall St updates its DCF calculation for every Emirian stock every day, so if you want to find the intrinsic value of any other stock just search here.
Valuation is complex, but we're here to simplify it.
Discover if Burjeel Holdings might be undervalued or overvalued with our detailed analysis, featuring fair value estimates, potential risks, dividends, insider trades, and its financial condition.
Access Free AnalysisHave feedback on this article? Concerned about the content? Get in touch with us directly. Alternatively, email editorial-team (at) simplywallst.com.
This article by Simply Wall St is general in nature. We provide commentary based on historical data and analyst forecasts only using an unbiased methodology and our articles are not intended to be financial advice. It does not constitute a recommendation to buy or sell any stock, and does not take account of your objectives, or your financial situation. We aim to bring you long-term focused analysis driven by fundamental data. Note that our analysis may not factor in the latest price-sensitive company announcements or qualitative material. Simply Wall St has no position in any stocks mentioned.
About ADX:BURJEEL
Burjeel Holdings
Owns and operates multi-specialty hospitals and medical centers in the United Arab Emirates, the Sultanate of Oman, and the Kingdom of Saudi Arabia.
Undervalued with high growth potential.
Market Insights

Community Narratives
