- United Arab Emirates
- /
- Industrials
- /
- ADX:MODON
Declining Stock and Decent Financials: Is The Market Wrong About Q Holding PSC (ADX:QHOLDING)?


With its stock down 4.3% over the past three months, it is easy to disregard Q Holding PSC (ADX:QHOLDING). But if you pay close attention, you might find that its key financial indicators look quite decent, which could mean that the stock could potentially rise in the long-term given how markets usually reward more resilient long-term fundamentals. Specifically, we decided to study Q Holding PSC's ROE in this article.
ROE or return on equity is a useful tool to assess how effectively a company can generate returns on the investment it received from its shareholders. In simpler terms, it measures the profitability of a company in relation to shareholder's equity.
View our latest analysis for Q Holding PSC
How Is ROE Calculated?
ROE can be calculated by using the formula:
Return on Equity = Net Profit (from continuing operations) ÷ Shareholders' Equity
So, based on the above formula, the ROE for Q Holding PSC is:
3.8% = د.إ570m ÷ د.إ15b (Based on the trailing twelve months to December 2023).
The 'return' is the yearly profit. One way to conceptualize this is that for each AED1 of shareholders' capital it has, the company made AED0.04 in profit.
What Is The Relationship Between ROE And Earnings Growth?
We have already established that ROE serves as an efficient profit-generating gauge for a company's future earnings. Depending on how much of these profits the company reinvests or "retains", and how effectively it does so, we are then able to assess a company’s earnings growth potential. Generally speaking, other things being equal, firms with a high return on equity and profit retention, have a higher growth rate than firms that don’t share these attributes.
A Side By Side comparison of Q Holding PSC's Earnings Growth And 3.8% ROE
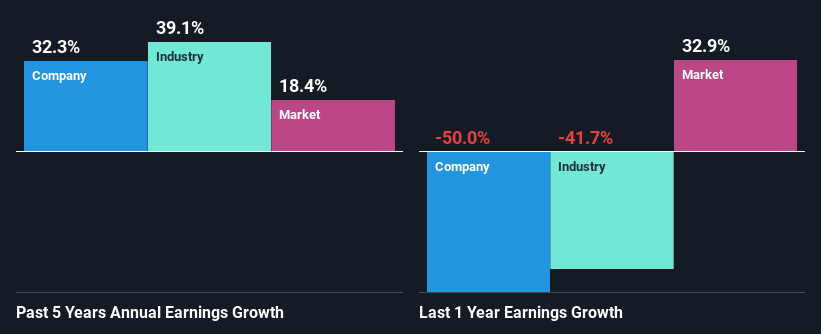
As you can see, Q Holding PSC's ROE looks pretty weak. Even when compared to the industry average of 9.8%, the ROE figure is pretty disappointing. Despite this, surprisingly, Q Holding PSC saw an exceptional 32% net income growth over the past five years. We believe that there might be other aspects that are positively influencing the company's earnings growth. For example, it is possible that the company's management has made some good strategic decisions, or that the company has a low payout ratio.
Next, on comparing Q Holding PSC's net income growth with the industry, we found that the company's reported growth is similar to the industry average growth rate of 39% over the last few years.
The basis for attaching value to a company is, to a great extent, tied to its earnings growth. The investor should try to establish if the expected growth or decline in earnings, whichever the case may be, is priced in. By doing so, they will have an idea if the stock is headed into clear blue waters or if swampy waters await. Is Q Holding PSC fairly valued compared to other companies? These 3 valuation measures might help you decide.
Is Q Holding PSC Making Efficient Use Of Its Profits?
Q Holding PSC doesn't pay any regular dividends currently which essentially means that it has been reinvesting all of its profits into the business. This definitely contributes to the high earnings growth number that we discussed above.
Summary
On the whole, we do feel that Q Holding PSC has some positive attributes. Despite its low rate of return, the fact that the company reinvests a very high portion of its profits into its business, no doubt contributed to its high earnings growth. While we won't completely dismiss the company, what we would do, is try to ascertain how risky the business is to make a more informed decision around the company. Our risks dashboard would have the 3 risks we have identified for Q Holding PSC.
New: Manage All Your Stock Portfolios in One Place
We've created the ultimate portfolio companion for stock investors, and it's free.
• Connect an unlimited number of Portfolios and see your total in one currency
• Be alerted to new Warning Signs or Risks via email or mobile
• Track the Fair Value of your stocks
Have feedback on this article? Concerned about the content? Get in touch with us directly. Alternatively, email editorial-team (at) simplywallst.com.
This article by Simply Wall St is general in nature. We provide commentary based on historical data and analyst forecasts only using an unbiased methodology and our articles are not intended to be financial advice. It does not constitute a recommendation to buy or sell any stock, and does not take account of your objectives, or your financial situation. We aim to bring you long-term focused analysis driven by fundamental data. Note that our analysis may not factor in the latest price-sensitive company announcements or qualitative material. Simply Wall St has no position in any stocks mentioned.
About ADX:MODON
Modon Holding PSC
Engages in the real estate, hospitality, and diversified investment activities in the United Arab Emirates and internationally.
Excellent balance sheet with proven track record.

