- United Arab Emirates
- /
- Banks
- /
- ADX:ADIB
Those who invested in Abu Dhabi Islamic Bank PJSC (ADX:ADIB) five years ago are up 219%


When you buy a stock there is always a possibility that it could drop 100%. But when you pick a company that is really flourishing, you can make more than 100%. One great example is Abu Dhabi Islamic Bank PJSC (ADX:ADIB) which saw its share price drive 143% higher over five years. Also pleasing for shareholders was the 11% gain in the last three months. But this move may well have been assisted by the reasonably buoyant market (up 5.8% in 90 days).
With that in mind, it's worth seeing if the company's underlying fundamentals have been the driver of long term performance, or if there are some discrepancies.
See our latest analysis for Abu Dhabi Islamic Bank PJSC
To quote Buffett, 'Ships will sail around the world but the Flat Earth Society will flourish. There will continue to be wide discrepancies between price and value in the marketplace...' One flawed but reasonable way to assess how sentiment around a company has changed is to compare the earnings per share (EPS) with the share price.
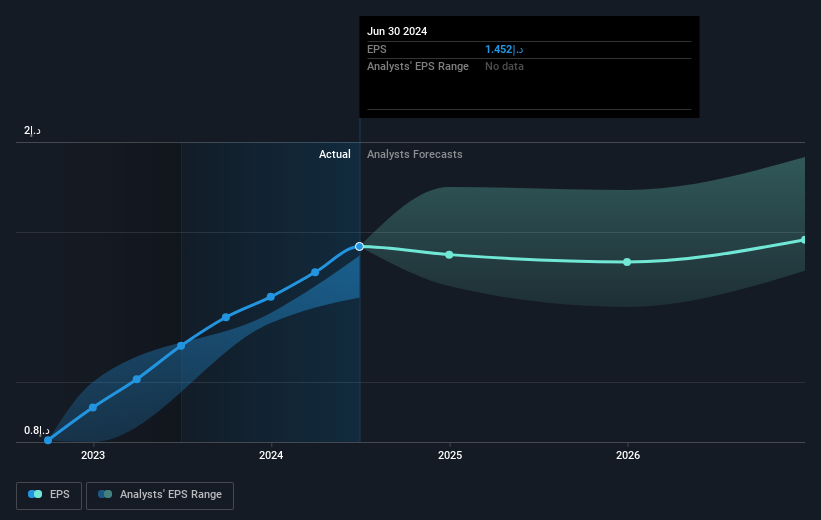
Over half a decade, Abu Dhabi Islamic Bank PJSC managed to grow its earnings per share at 19% a year. That makes the EPS growth particularly close to the yearly share price growth of 19%. This indicates that investor sentiment towards the company has not changed a great deal. In fact, the share price seems to largely reflect the EPS growth.
The image below shows how EPS has tracked over time (if you click on the image you can see greater detail).
It is of course excellent to see how Abu Dhabi Islamic Bank PJSC has grown profits over the years, but the future is more important for shareholders. This free interactive report on Abu Dhabi Islamic Bank PJSC's balance sheet strength is a great place to start, if you want to investigate the stock further.
What About Dividends?
It is important to consider the total shareholder return, as well as the share price return, for any given stock. The TSR is a return calculation that accounts for the value of cash dividends (assuming that any dividend received was reinvested) and the calculated value of any discounted capital raisings and spin-offs. Arguably, the TSR gives a more comprehensive picture of the return generated by a stock. We note that for Abu Dhabi Islamic Bank PJSC the TSR over the last 5 years was 219%, which is better than the share price return mentioned above. This is largely a result of its dividend payments!
A Different Perspective
We're pleased to report that Abu Dhabi Islamic Bank PJSC shareholders have received a total shareholder return of 28% over one year. Of course, that includes the dividend. That's better than the annualised return of 26% over half a decade, implying that the company is doing better recently. Someone with an optimistic perspective could view the recent improvement in TSR as indicating that the business itself is getting better with time. While it is well worth considering the different impacts that market conditions can have on the share price, there are other factors that are even more important. Even so, be aware that Abu Dhabi Islamic Bank PJSC is showing 1 warning sign in our investment analysis , you should know about...
But note: Abu Dhabi Islamic Bank PJSC may not be the best stock to buy. So take a peek at this free list of interesting companies with past earnings growth (and further growth forecast).
Please note, the market returns quoted in this article reflect the market weighted average returns of stocks that currently trade on Emirian exchanges.
New: Manage All Your Stock Portfolios in One Place
We've created the ultimate portfolio companion for stock investors, and it's free.
• Connect an unlimited number of Portfolios and see your total in one currency
• Be alerted to new Warning Signs or Risks via email or mobile
• Track the Fair Value of your stocks
Have feedback on this article? Concerned about the content? Get in touch with us directly. Alternatively, email editorial-team (at) simplywallst.com.
This article by Simply Wall St is general in nature. We provide commentary based on historical data and analyst forecasts only using an unbiased methodology and our articles are not intended to be financial advice. It does not constitute a recommendation to buy or sell any stock, and does not take account of your objectives, or your financial situation. We aim to bring you long-term focused analysis driven by fundamental data. Note that our analysis may not factor in the latest price-sensitive company announcements or qualitative material. Simply Wall St has no position in any stocks mentioned.
About ADX:ADIB
Abu Dhabi Islamic Bank PJSC
Provides banking, financing, and investing services in the United Arab Emirates, rest of the Middle East, and internationally.
Proven track record with adequate balance sheet and pays a dividend.
Market Insights

Community Narratives


