
Advertisement
- United States
- /
- Professional Services
- /
- NasdaqGS:SAIC
Would Science Applications International Corporation (NYSE:SAIC) Be Valuable To Income Investors?

Today we'll take a closer look at Science Applications International Corporation (NYSE:SAIC) from a dividend investor's perspective. Owning a strong business and reinvesting the dividends is widely seen as an attractive way of growing your wealth. On the other hand, investors have been known to buy a stock because of its yield, and then lose money if the company's dividend doesn't live up to expectations.
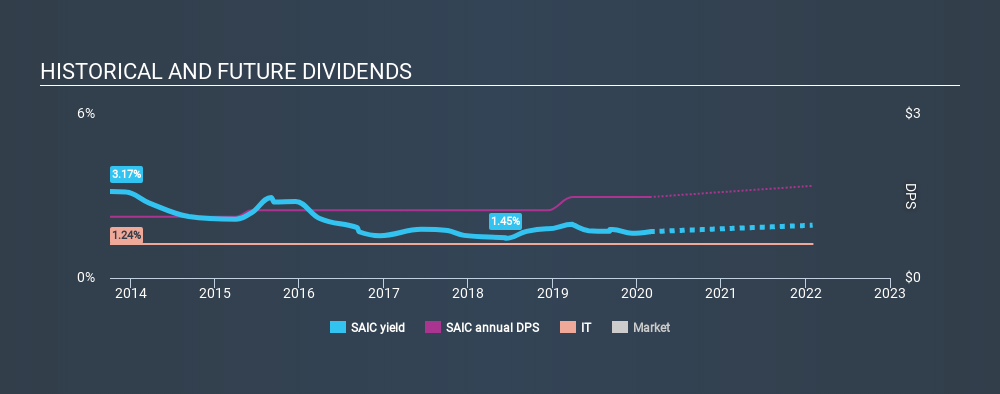
Investors might not know much about Science Applications International's dividend prospects, even though it has been paying dividends for the last six years and offers a 1.7% yield. A 1.7% yield is not inspiring, but the longer payment history has some appeal. The company also bought back stock equivalent to around 4.0% of market capitalisation this year. Some simple research can reduce the risk of buying Science Applications International for its dividend - read on to learn more.
Explore this interactive chart for our latest analysis on Science Applications International!
Payout ratios
Dividends are usually paid out of company earnings. If a company is paying more than it earns, then the dividend might become unsustainable - hardly an ideal situation. As a result, we should always investigate whether a company can afford its dividend, measured as a percentage of a company's net income after tax. Looking at the data, we can see that 50% of Science Applications International's profits were paid out as dividends in the last 12 months. This is a medium payout level that leaves enough capital in the business to fund opportunities that might arise, while also rewarding shareholders. One of the risks is that management reinvests the retained capital poorly instead of paying a higher dividend.
Another important check we do is to see if the free cash flow generated is sufficient to pay the dividend. Science Applications International's cash payout ratio last year was 20%. Cash flows are typically lumpy, but this looks like an appropriately conservative payout. It's positive to see that Science Applications International's dividend is covered by both profits and cash flow, since this is generally a sign that the dividend is sustainable, and a lower payout ratio usually suggests a greater margin of safety before the dividend gets cut.
Is Science Applications International's Balance Sheet Risky?
As Science Applications International has a meaningful amount of debt, we need to check its balance sheet to see if the company might have debt risks. A quick check of its financial situation can be done with two ratios: net debt divided by EBITDA (earnings before interest, tax, depreciation and amortisation), and net interest cover. Net debt to EBITDA is a measure of a company's total debt. Net interest cover measures the ability to meet interest payments. Essentially we check that a) the company does not have too much debt, and b) that it can afford to pay the interest. Science Applications International has net debt of 3.65 times its EBITDA, which is getting towards the limit of most investors' comfort zones. Judicious use of debt can enhance shareholder returns, but also adds to the risk if something goes awry.
We calculated its interest cover by measuring its earnings before interest and tax (EBIT), and dividing this by the company's net interest expense. With EBIT of 4.65 times its interest expense, Science Applications International's interest cover is starting to look a bit thin.
Remember, you can always get a snapshot of Science Applications International's latest financial position, by checking our visualisation of its financial health.
Dividend Volatility
Before buying a stock for its income, we want to see if the dividends have been stable in the past, and if the company has a track record of maintaining its dividend. Looking at the data, we can see that Science Applications International has been paying a dividend for the past six years. Its dividend has not fluctuated much that time, which we like, but we're conscious that the company might not yet have a track record of maintaining dividends in all economic conditions. During the past six-year period, the first annual payment was US$1.12 in 2014, compared to US$1.48 last year. This works out to be a compound annual growth rate (CAGR) of approximately 4.8% a year over that time.
We like that the dividend hasn't been shrinking. However we're conscious that the company hasn't got an overly long track record of dividend payments yet, which makes us wary of relying on its dividend income.
Dividend Growth Potential
While dividend payments have been relatively reliable, it would also be nice if earnings per share (EPS) were growing, as this is essential to maintaining the dividend's purchasing power over the long term. Earnings have grown at around 4.2% a year for the past five years, which is better than seeing them shrink! A payout ratio below 50% leaves ample room to reinvest in the business, and provides finanical flexibility. Earnings per share growth have grown slowly, which is not great, but if the retained earnings can be reinvested effectively, future growth may be stronger.
Conclusion
When we look at a dividend stock, we need to form a judgement on whether the dividend will grow, if the company is able to maintain it in a wide range of economic circumstances, and if the dividend payout is sustainable. It's great to see that Science Applications International is paying out a low percentage of its earnings and cash flow. Unfortunately, earnings growth has also been mediocre, and we think it has not been paying dividends long enough to demonstrate resilience across economic cycles. Science Applications International has a number of positive attributes, but it falls slightly short of our (admittedly high) standards. Were there evidence of a strong moat or an attractive valuation, it could still be well worth a look.
Earnings growth generally bodes well for the future value of company dividend payments. See if the 8 Science Applications International analysts we track are forecasting continued growth with our free report on analyst estimates for the company.
We have also put together a list of global stocks with a market capitalisation above $1bn and yielding more 3%.
If you spot an error that warrants correction, please contact the editor at editorial-team@simplywallst.com. This article by Simply Wall St is general in nature. It does not constitute a recommendation to buy or sell any stock, and does not take account of your objectives, or your financial situation. Simply Wall St has no position in the stocks mentioned.
We aim to bring you long-term focused research analysis driven by fundamental data. Note that our analysis may not factor in the latest price-sensitive company announcements or qualitative material. Thank you for reading.
About NasdaqGS:SAIC
Science Applications International
Provides technical, engineering, and enterprise information technology (IT) services in the United States.
Undervalued average dividend payer.
Similar Companies
Market Insights


Advertisement
Community Narratives
The Future of Drug Testing? Fingerprint Tech Shows Serious Promise
Fair Value US$2.98|40.3% undervalued
JO
Community Contributor
Suncorp’s Next Chapter: Insurance-Only and Ready to Grow
Fair Value AU$22.83|7.9% undervalued
RO
Community Contributor
Thyssenkrupp Nucera Will Achieve Double-Digit Profits by 2030 Boosted by Hydrogen Growth
Fair Value €14.40|31.3% undervalued
CH
Community Contributor
Tesla’s Nvidia Moment – The AI & Robotics Inflection Point
Fair Value US$359.72|12.3% undervalued
BL
Community Contributor