

What are the early trends we should look for to identify a stock that could multiply in value over the long term? One common approach is to try and find a company with returns on capital employed (ROCE) that are increasing, in conjunction with a growing amount of capital employed. Ultimately, this demonstrates that it's a business that is reinvesting profits at increasing rates of return. However, after briefly looking over the numbers, we don't think S.P. Apparels (NSE:SPAL) has the makings of a multi-bagger going forward, but let's have a look at why that may be.
Understanding Return On Capital Employed (ROCE)
For those who don't know, ROCE is a measure of a company's yearly pre-tax profit (its return), relative to the capital employed in the business. The formula for this calculation on S.P. Apparels is:
Return on Capital Employed = Earnings Before Interest and Tax (EBIT) ÷ (Total Assets - Current Liabilities)
0.071 = ₹433m ÷ (₹8.9b - ₹2.8b) (Based on the trailing twelve months to June 2020).
Thus, S.P. Apparels has an ROCE of 7.1%. On its own, that's a low figure but it's around the 8.5% average generated by the Luxury industry.
View our latest analysis for S.P. Apparels
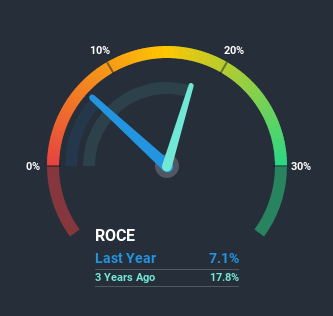
In the above chart we have measured S.P. Apparels' prior ROCE against its prior performance, but the future is arguably more important. If you're interested, you can view the analysts predictions in our free report on analyst forecasts for the company.
What Does the ROCE Trend For S.P. Apparels Tell Us?
When we looked at the ROCE trend at S.P. Apparels, we didn't gain much confidence. Around five years ago the returns on capital were 26%, but since then they've fallen to 7.1%. And considering revenue has dropped while employing more capital, we'd be cautious. This could mean that the business is losing its competitive advantage or market share, because while more money is being put into ventures, it's actually producing a lower return - "less bang for their buck" per se.
On a side note, S.P. Apparels has done well to pay down its current liabilities to 31% of total assets. So we could link some of this to the decrease in ROCE. Effectively this means their suppliers or short-term creditors are funding less of the business, which reduces some elements of risk. Since the business is basically funding more of its operations with it's own money, you could argue this has made the business less efficient at generating ROCE.What We Can Learn From S.P. Apparels' ROCE
From the above analysis, we find it rather worrisome that returns on capital and sales for S.P. Apparels have fallen, meanwhile the business is employing more capital than it was five years ago. It should come as no surprise then that the stock has fallen 66% over the last three years, so it looks like investors are recognizing these changes. With underlying trends that aren't great in these areas, we'd consider looking elsewhere.
If you want to continue researching S.P. Apparels, you might be interested to know about the 4 warning signs that our analysis has discovered.
For those who like to invest in solid companies, check out this free list of companies with solid balance sheets and high returns on equity.
When trading S.P. Apparels or any other investment, use the platform considered by many to be the Professional's Gateway to the Worlds Market, Interactive Brokers. You get the lowest-cost* trading on stocks, options, futures, forex, bonds and funds worldwide from a single integrated account. Promoted
New: Manage All Your Stock Portfolios in One Place
We've created the ultimate portfolio companion for stock investors, and it's free.
• Connect an unlimited number of Portfolios and see your total in one currency
• Be alerted to new Warning Signs or Risks via email or mobile
• Track the Fair Value of your stocks
This article by Simply Wall St is general in nature. It does not constitute a recommendation to buy or sell any stock, and does not take account of your objectives, or your financial situation. We aim to bring you long-term focused analysis driven by fundamental data. Note that our analysis may not factor in the latest price-sensitive company announcements or qualitative material. Simply Wall St has no position in any stocks mentioned.
*Interactive Brokers Rated Lowest Cost Broker by StockBrokers.com Annual Online Review 2020
Have feedback on this article? Concerned about the content? Get in touch with us directly. Alternatively, email editorial-team@simplywallst.com.
About NSEI:SPAL
S.P. Apparels
Engages in manufacturing and exporting of knitted garments for infants and children in India and internationally.
Flawless balance sheet and good value.
Similar Companies
Market Insights

Community Narratives

