Advertisement
- United States
- /
- Electronic Equipment and Components
- /
- NasdaqGS:ZBRA
Why Zebra Technologies Corporation's (NASDAQ:ZBRA) High P/E Ratio Isn't Necessarily A Bad Thing
The goal of this article is to teach you how to use price to earnings ratios (P/E ratios). We'll apply a basic P/E ratio analysis to Zebra Technologies Corporation's (NASDAQ:ZBRA), to help you decide if the stock is worth further research. Zebra Technologies has a price to earnings ratio of 22.11, based on the last twelve months. That means that at current prices, buyers pay $22.11 for every $1 in trailing yearly profits.
Check out our latest analysis for Zebra Technologies
How Do I Calculate Zebra Technologies's Price To Earnings Ratio?
The formula for P/E is:
Price to Earnings Ratio = Share Price ÷ Earnings per Share (EPS)
Or for Zebra Technologies:
P/E of 22.11 = $197.42 ÷ $8.93 (Based on the year to June 2019.)
Is A High Price-to-Earnings Ratio Good?
A higher P/E ratio implies that investors pay a higher price for the earning power of the business. That is not a good or a bad thing per se, but a high P/E does imply buyers are optimistic about the future.
How Does Zebra Technologies's P/E Ratio Compare To Its Peers?
The P/E ratio essentially measures market expectations of a company. The image below shows that Zebra Technologies has a higher P/E than the average (19.9) P/E for companies in the electronic industry.
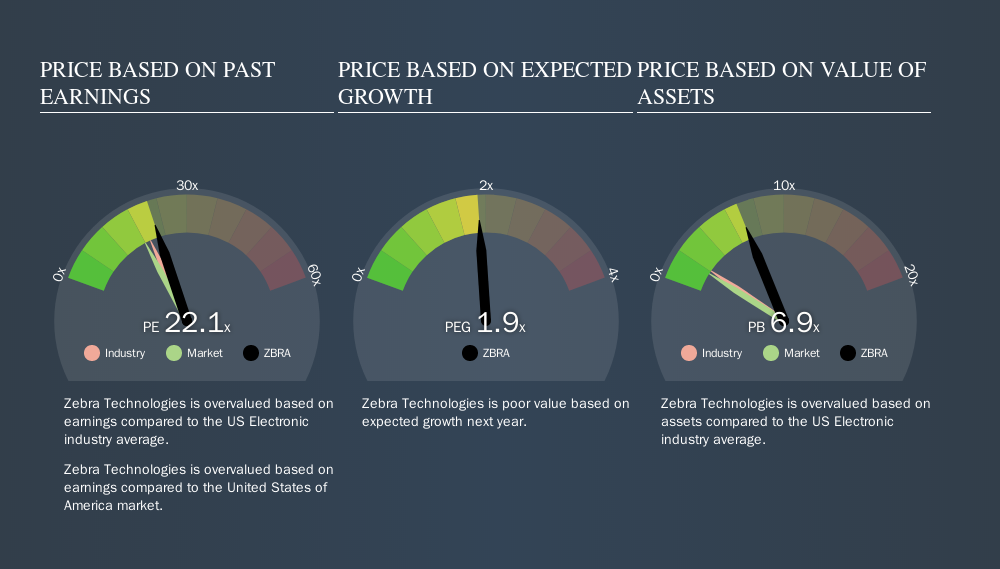
Zebra Technologies's P/E tells us that market participants think the company will perform better than its industry peers, going forward.
How Growth Rates Impact P/E Ratios
P/E ratios primarily reflect market expectations around earnings growth rates. Earnings growth means that in the future the 'E' will be higher. That means unless the share price increases, the P/E will reduce in a few years. Then, a lower P/E should attract more buyers, pushing the share price up.
Zebra Technologies's earnings made like a rocket, taking off 182% last year. The cherry on top is that the five year growth rate was an impressive 25% per year. So I'd be surprised if the P/E ratio was not above average.
A Limitation: P/E Ratios Ignore Debt and Cash In The Bank
The 'Price' in P/E reflects the market capitalization of the company. Thus, the metric does not reflect cash or debt held by the company. In theory, a company can lower its future P/E ratio by using cash or debt to invest in growth.
Spending on growth might be good or bad a few years later, but the point is that the P/E ratio does not account for the option (or lack thereof).
So What Does Zebra Technologies's Balance Sheet Tell Us?
Zebra Technologies's net debt is 16% of its market cap. It would probably deserve a higher P/E ratio if it was net cash, since it would have more options for growth.
The Bottom Line On Zebra Technologies's P/E Ratio
Zebra Technologies's P/E is 22.1 which is above average (18.2) in its market. The company is not overly constrained by its modest debt levels, and its recent EPS growth is nothing short of stand-out. So to be frank we are not surprised it has a high P/E ratio.
Investors should be looking to buy stocks that the market is wrong about. People often underestimate remarkable growth -- so investors can make money when fast growth is not fully appreciated. So this free visual report on analyst forecasts could hold the key to an excellent investment decision.
Of course you might be able to find a better stock than Zebra Technologies. So you may wish to see this free collection of other companies that have grown earnings strongly.
We aim to bring you long-term focused research analysis driven by fundamental data. Note that our analysis may not factor in the latest price-sensitive company announcements or qualitative material.
If you spot an error that warrants correction, please contact the editor at editorial-team@simplywallst.com. This article by Simply Wall St is general in nature. It does not constitute a recommendation to buy or sell any stock, and does not take account of your objectives, or your financial situation. Simply Wall St has no position in the stocks mentioned. Thank you for reading.
About NasdaqGS:ZBRA
Zebra Technologies
Operates in the automatic identification and data capture solutions industry worldwide.
Very undervalued with low risk.
Similar Companies
Market Insights


Advertisement
Weekly Picks
CE


Ceazar on Sparc AI ·
When GPS fails: this small cap is fixing a $54B drone problem
Fair Value:CA$5.2540.0% undervalued
81 followersusers have followed this narrative
0 commentsusers have commented on this narrative
20 likesusers have liked this narrative
HE


HedgeY on IonQ ·
The Best-Funded Quantum Platform and Still a Stock Priced for Perfection
Fair Value:US$482.3% overvalued
31 followersusers have followed this narrative
0 commentsusers have commented on this narrative
8 likesusers have liked this narrative
BL


BlackGoat on Cerebras Systems ·
The Wafer Giant Threatening NVIDIA's GPU Hegemony
Fair Value:US$415.5450.7% undervalued
54 followersusers have followed this narrative
1 commentusers have commented on this narrative
8 likesusers have liked this narrative
IV

Ivoed on Netflix ·
Netflix’s Business Quality Is Clear. The Harder Question Is Whether The Stock Is Still Cheap
Fair Value:US$825.3% undervalued
26 followersusers have followed this narrative
2 commentsusers have commented on this narrative
9 likesusers have liked this narrative
Recently Updated Narratives
CU

CubanEros on Microsoft ·
A wonderful business at reasonable price.
Fair Value:US$419.917.0% undervalued
3 followersusers have followed this narrative
0 commentsusers have commented on this narrative
0 likesusers have liked this narrative
DR


DrPotato on TeamViewer ·
TeamViewer Set to Evolve from Stagnation to Enterprise Growth by 2028
Fair Value:€13.3260.9% undervalued
4 followersusers have followed this narrative
0 commentsusers have commented on this narrative
0 likesusers have liked this narrative
JO


John_Eric on Veeva Systems ·
AI-Powered Veeva Systems Poised for Solid Growth Amid Regulatory Stability
Fair Value:US$32039.8% undervalued
4 followersusers have followed this narrative
0 commentsusers have commented on this narrative
0 likesusers have liked this narrative
Popular Narratives
IN


Investingwilly on Mastercard ·
Mastercard: The Best Dividend Stock You're Ignoring
Fair Value:US$75028.1% undervalued
82 followersusers have followed this narrative
1 commentusers have commented on this narrative
9 likesusers have liked this narrative
HA


HarishPK on Adobe ·
Adobe: A Probabilistic Case for Undervaluation
Fair Value:US$319.9631.3% undervalued
63 followersusers have followed this narrative
9 commentsusers have commented on this narrative
19 likesusers have liked this narrative
NI


niteco on Broadcom ·
A Capital Allocation Favorite with Structural Importance
Fair Value:US$651.0544.6% undervalued
56 followersusers have followed this narrative
0 commentsusers have commented on this narrative
13 likesusers have liked this narrative
Trending Discussion

PR


ProjectKai on Iovance Biotherapeutics ·
Polip, this is Kai. When do you estimate IOVA could reach a $12–20 billion valuation, implying rough...
0
|0
