
Advertisement
- Hong Kong
- /
- Electrical
- /
- SEHK:1750
Why REM Group (Holdings) Limited’s (HKG:1750) Return On Capital Employed Is Impressive
Today we are going to look at REM Group (Holdings) Limited (HKG:1750) to see whether it might be an attractive investment prospect. In particular, we'll consider its Return On Capital Employed (ROCE), as that can give us insight into how profitably the company is able to employ capital in its business.
First up, we'll look at what ROCE is and how we calculate it. Second, we'll look at its ROCE compared to similar companies. Finally, we'll look at how its current liabilities affect its ROCE.
What is Return On Capital Employed (ROCE)?
ROCE is a measure of a company's yearly pre-tax profit (its return), relative to the capital employed in the business. In general, businesses with a higher ROCE are usually better quality. Ultimately, it is a useful but imperfect metric. Author Edwin Whiting says to be careful when comparing the ROCE of different businesses, since 'No two businesses are exactly alike.
How Do You Calculate Return On Capital Employed?
The formula for calculating the return on capital employed is:
Return on Capital Employed = Earnings Before Interest and Tax (EBIT) ÷ (Total Assets - Current Liabilities)
Or for REM Group (Holdings):
0.13 = HK$26m ÷ (HK$269m - HK$65m) (Based on the trailing twelve months to June 2019.)
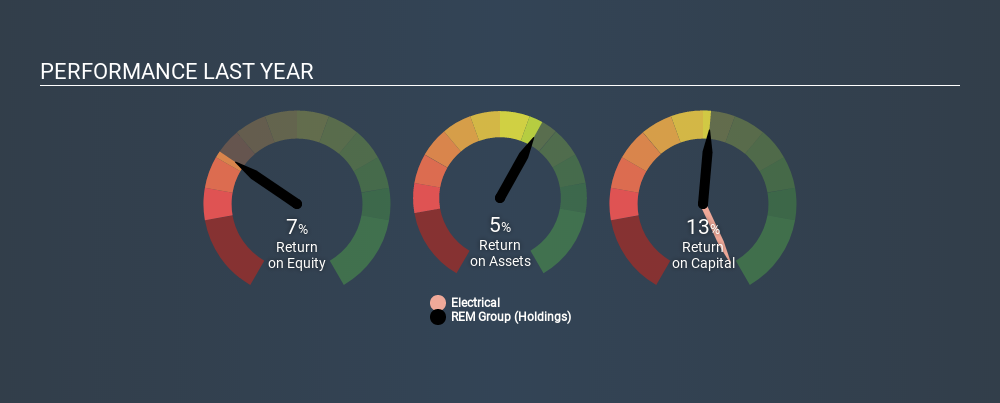
So, REM Group (Holdings) has an ROCE of 13%.
Check out our latest analysis for REM Group (Holdings)
Is REM Group (Holdings)'s ROCE Good?
One way to assess ROCE is to compare similar companies. REM Group (Holdings)'s ROCE appears to be substantially greater than the 8.1% average in the Electrical industry. We would consider this a positive, as it suggests it is using capital more effectively than other similar companies. Separate from REM Group (Holdings)'s performance relative to its industry, its ROCE in absolute terms looks satisfactory, and it may be worth researching in more depth.
REM Group (Holdings)'s current ROCE of 13% is lower than its ROCE in the past, which was 44%, 3 years ago. Therefore we wonder if the company is facing new headwinds. You can click on the image below to see (in greater detail) how REM Group (Holdings)'s past growth compares to other companies.
It is important to remember that ROCE shows past performance, and is not necessarily predictive. ROCE can be deceptive for cyclical businesses, as returns can look incredible in boom times, and terribly low in downturns. ROCE is only a point-in-time measure. If REM Group (Holdings) is cyclical, it could make sense to check out this free graph of past earnings, revenue and cash flow.
How REM Group (Holdings)'s Current Liabilities Impact Its ROCE
Current liabilities include invoices, such as supplier payments, short-term debt, or a tax bill, that need to be paid within 12 months. The ROCE equation subtracts current liabilities from capital employed, so a company with a lot of current liabilities appears to have less capital employed, and a higher ROCE than otherwise. To counter this, investors can check if a company has high current liabilities relative to total assets.
REM Group (Holdings) has total liabilities of HK$65m and total assets of HK$269m. As a result, its current liabilities are equal to approximately 24% of its total assets. A fairly low level of current liabilities is not influencing the ROCE too much.
Our Take On REM Group (Holdings)'s ROCE
With that in mind, REM Group (Holdings)'s ROCE appears pretty good. REM Group (Holdings) shapes up well under this analysis, but it is far from the only business delivering excellent numbers . You might also want to check this free collection of companies delivering excellent earnings growth.
If you are like me, then you will not want to miss this free list of growing companies that insiders are buying.
If you spot an error that warrants correction, please contact the editor at editorial-team@simplywallst.com. This article by Simply Wall St is general in nature. It does not constitute a recommendation to buy or sell any stock, and does not take account of your objectives, or your financial situation. Simply Wall St has no position in the stocks mentioned.
We aim to bring you long-term focused research analysis driven by fundamental data. Note that our analysis may not factor in the latest price-sensitive company announcements or qualitative material. Thank you for reading.
MI

The Foxhole
A landmark settlement is meant to punish Meta (META). If the 1998 tobacco deal is any guide, it might protect it.
159
ZO
zoe_vi5fn
Any moat with an opt-out clause for your competitors is just a fence around your own garden.
CO
connor_iwn1g
Worth looking at what previous legal action actually did to Meta rather than reaching for tobacco. The FTC's record five billion dollar privacy fine in 2019 was met with the stock rising, because it came in below fears and removed an open question. GDPR was designed to constrain large platforms and increased their share of the European ad market, because compliance cost fell hardest on small intermediaries. The FTC's antitrust case, the one that could genuinely have broken the company up, was decided in Meta's favour last November. The only thing that ever meaningfully hurt the business was Apple changing a tracking default, and Meta out-spent that too, while the ad-tech firms that could not afford to rebuild disappeared. The pattern is not that Meta survives regulation. It is that regulation keeps costing its smaller competitors more.
 Andrew Legget
Market Insights
Great earnings season, but are the earnings real?

At first glance, this was the strongest earnings season in years. But when you look at where the growth actually came from, the story splits into two very different pictures.
10
About SEHK:1750
REM Group (Holdings)
An investment holding company, engages in the manufacture and sale of low-voltage electrical power distribution and control devices in Hong Kong, Macau, and the Mainland China.
Flawless balance sheet and fair value.
Market Insights


Advertisement
Weekly Picks
LO


Lou_Basenese on Oncolytics Biotech ·
The Team Behind a $2 Billion Johnson & Johnson (JNJ) Deal Just Took Over This $105 Million Cancer Biotech
Fair Value:US$3.575.5% undervalued
29 followersusers have followed this narrative
0 commentsusers have commented on this narrative
7 likesusers have liked this narrative
TR


tripledub on Meta Platforms ·
The $135 Billion Bet That Should Make Every Shareholder Nervous
Fair Value:US$5861.4% undervalued
61 followersusers have followed this narrative
3 commentsusers have commented on this narrative
34 likesusers have liked this narrative
TA


Talos on Voyager Technologies ·
The "Landlord of Orbit" – A Deep Value Play Ahead of the Starlab Era
Fair Value:US$385.291.1% undervalued
64 followersusers have followed this narrative
0 commentsusers have commented on this narrative
6 likesusers have liked this narrative
IV

Ivoed on Uber Technologies ·
Uber’s Valuation Depends On Who Captures The Economics Of Driverless Rides
Fair Value:US$11632.1% undervalued
12 followersusers have followed this narrative
0 commentsusers have commented on this narrative
3 likesusers have liked this narrative
Recently Updated Narratives
TR

tripledub on Taiwan Semiconductor Manufacturing ·
The Most Wonderful Monopoly in the Most Dangerous Neighbourhood on Earth
Fair Value:US$378.2910.4% overvalued
83 followersusers have followed this narrative
1 commentusers have commented on this narrative
0 likesusers have liked this narrative
RO


Rog on Tomra Systems ·
Why Tomra is a great catch right now!
Fair Value:NOK 243.4354.9% undervalued
1 followerusers have followed this narrative
0 commentsusers have commented on this narrative
0 likesusers have liked this narrative
DA

dang on Resonance Health ·
Resonance Health will triple revenue growth to 30.83% in five years
Fair Value:AU$0.08331.3% undervalued
1 followerusers have followed this narrative
0 commentsusers have commented on this narrative
0 likesusers have liked this narrative
Popular Narratives
OS


oscargarcia on NVIDIA ·
The company that went from selling GPUs to gamers to becoming the AI arms dealer of the 21st century.
Fair Value:US$28022.3% undervalued
364 followersusers have followed this narrative
9 commentsusers have commented on this narrative
16 likesusers have liked this narrative
CU

CubanEros on Microsoft ·
A wonderful business at reasonable price.
Fair Value:US$419.9122.3% overvalued
213 followersusers have followed this narrative
0 commentsusers have commented on this narrative
9 likesusers have liked this narrative
KI

KiwiInvest on Amazon.com ·
Amazon's high growth, high tech segments propel its profits, while traditional segments plod along
Fair Value:US$475.0943.9% undervalued
240 followersusers have followed this narrative
1 commentusers have commented on this narrative
8 likesusers have liked this narrative


