
Advertisement
- United Kingdom
- /
- Residential REITs
- /
- LSE:GRI
What To Know Before Buying Grainger plc (LON:GRI) For Its Dividend
Is Grainger plc (LON:GRI) a good dividend stock? How can we tell? Dividend paying companies with growing earnings can be highly rewarding in the long term. If you are hoping to live on the income from dividends, it's important to be a lot more stringent with your investments than the average punter.
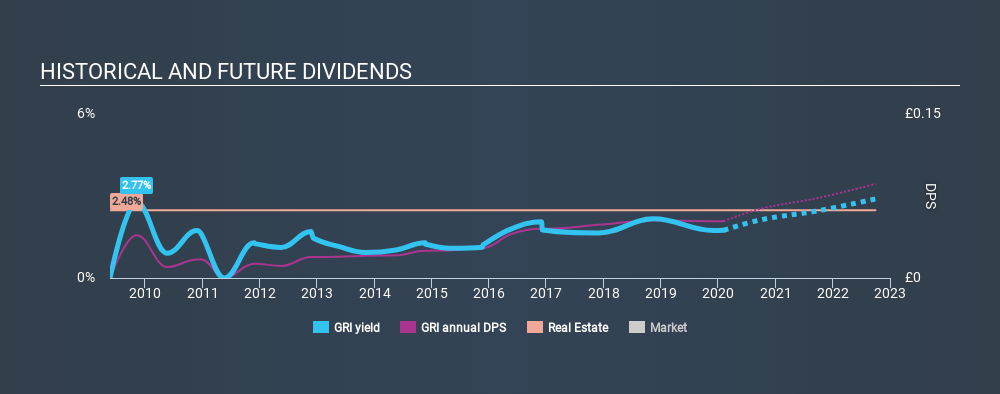
While Grainger's 1.7% dividend yield is not the highest, we think its lengthy payment history is quite interesting. When buying stocks for their dividends, you should always run through the checks below, to see if the dividend looks sustainable.
Explore this interactive chart for our latest analysis on Grainger!
Payout ratios
Companies (usually) pay dividends out of their earnings. If a company is paying more than it earns, the dividend might have to be cut. So we need to form a view on if a company's dividend is sustainable, relative to its net profit after tax. Grainger paid out 26% of its profit as dividends, over the trailing twelve month period. This is a middling range that strikes a nice balance between paying dividends to shareholders, and retaining enough earnings to invest in future growth. Besides, if reinvestment opportunities dry up, the company has room to increase the dividend.
In addition to comparing dividends against profits, we should inspect whether the company generated enough cash to pay its dividend. Grainger paid out 14% of its free cash flow as dividends last year, which is conservative and suggests the dividend is sustainable. It's encouraging to see that the dividend is covered by both profit and cash flow. This generally suggests the dividend is sustainable, as long as earnings don't drop precipitously.
Is Grainger's Balance Sheet Risky?
As Grainger has a meaningful amount of debt, we need to check its balance sheet to see if the company might have debt risks. A rough way to check this is with these two simple ratios: a) net debt divided by EBITDA (earnings before interest, tax, depreciation and amortisation), and b) net interest cover. Net debt to EBITDA measures total debt load relative to company earnings (lower = less debt), while net interest cover measures the ability to pay interest on the debt (higher = greater ability to pay interest costs). Grainger has net debt of 10.44 times its EBITDA, which we think carries substantial risk if earnings aren't sustainable.
Net interest cover can be calculated by dividing earnings before interest and tax (EBIT) by the company's net interest expense. Interest cover of 4.27 times its interest expense is starting to become a concern for Grainger, and be aware that lenders may place additional restrictions on the company as well. High debt and weak interest cover are not a great combo, and we would be cautious of relying on this company's dividend while these metrics persist.
We update our data on Grainger every 24 hours, so you can always get our latest analysis of its financial health, here.
Dividend Volatility
One of the major risks of relying on dividend income, is the potential for a company to struggle financially and cut its dividend. Not only is your income cut, but the value of your investment declines as well - nasty. For the purpose of this article, we only scrutinise the last decade of Grainger's dividend payments. Its dividend payments have declined on at least one occasion over the past ten years. During the past ten-year period, the first annual payment was UK£0.039 in 2010, compared to UK£0.052 last year. This works out to be a compound annual growth rate (CAGR) of approximately 2.9% a year over that time. The growth in dividends has not been linear, but the CAGR is a decent approximation of the rate of change over this time frame.
We're glad to see the dividend has risen, but with a limited rate of growth and fluctuations in the payments, we don't think this is an attractive combination.
Dividend Growth Potential
Given that the dividend has been cut in the past, we need to check if earnings are growing and if that might lead to stronger dividends in the future. Grainger's earnings per share have been essentially flat over the past five years. Over the long term, steady earnings per share is a risk as the value of the dividends can be reduced by inflation. Grainger is paying out less than half of its earnings, which we like. However, earnings per share are unfortunately not growing much. Might this suggest that the company should pay a higher dividend instead?
We'd also point out that Grainger issued a meaningful number of new shares in the past year. Trying to grow the dividend when issuing new shares reminds us of the ancient Greek tale of Sisyphus - perpetually pushing a boulder uphill. Companies that consistently issue new shares are often suboptimal from a dividend perspective.
Conclusion
When we look at a dividend stock, we need to form a judgement on whether the dividend will grow, if the company is able to maintain it in a wide range of economic circumstances, and if the dividend payout is sustainable. Firstly, we like that Grainger has low and conservative payout ratios. Second, earnings have been essentially flat, and its history of dividend payments is chequered - having cut its dividend at least once in the past. Grainger has a number of positive attributes, but it falls slightly short of our (admittedly high) standards. Were there evidence of a strong moat or an attractive valuation, it could still be well worth a look.
Earnings growth generally bodes well for the future value of company dividend payments. See if the 3 Grainger analysts we track are forecasting continued growth with our free report on analyst estimates for the company.
If you are a dividend investor, you might also want to look at our curated list of dividend stocks yielding above 3%.
If you spot an error that warrants correction, please contact the editor at editorial-team@simplywallst.com. This article by Simply Wall St is general in nature. It does not constitute a recommendation to buy or sell any stock, and does not take account of your objectives, or your financial situation. Simply Wall St has no position in the stocks mentioned.
We aim to bring you long-term focused research analysis driven by fundamental data. Note that our analysis may not factor in the latest price-sensitive company announcements or qualitative material. Thank you for reading.
M

The Foxhole
The US closed a loophole that helped Temu and Shein. Does that put local retailers back on a level playing field?
57

Jake_Merritt
The domestic retailers competing most directly with Temu and Shein are themselves among the largest importers in the country.
a
arjun_dyig0
Zooming out and looking at the effect of these regulatory changes last year, US manufacturing - production is at a seven year high. But employment is down. It's is interesting,
 Andrew Legget
Market Insights
Are social media stocks the new Big Tobacco?

Greater regulatory scrutiny is catching up with digital platforms, posing a rising risk for social media stocks. But as Big Tobacco discovered, that's not always a bad outcome for shareholders.
11
About LSE:GRI
Grainger
Designs, builds, develops, owns and operates rental homes in the United Kingdom.
Undervalued established dividend payer.
Similar Companies
Market Insights


Advertisement
Weekly Picks
CE


Ceazar on Sparc AI ·
When GPS fails: this small cap is fixing a $54B drone problem
Fair Value:CA$5.2541.0% undervalued
189 followersusers have followed this narrative
0 commentsusers have commented on this narrative
29 likesusers have liked this narrative
WE


WealthAP on Copart ·
Copart’s Share Price Fell. Its Moat Did Not.
Fair Value:US$4938.9% undervalued
42 followersusers have followed this narrative
2 commentsusers have commented on this narrative
13 likesusers have liked this narrative
IV


Ivoed on ASML Holding ·
ASML’s China Sell-Off Looks Overdone, Yet The Shares Are Not Cheap
Fair Value:€1.78k16.9% undervalued
29 followersusers have followed this narrative
0 commentsusers have commented on this narrative
8 likesusers have liked this narrative
FU


FundamentalContrarianInvestor on Universal Music Group ·
Universal Music Group: The Market Is Pricing the Quarter, Not the Catalogue
Fair Value:€23.2537.2% undervalued
11 followersusers have followed this narrative
0 commentsusers have commented on this narrative
3 likesusers have liked this narrative
Recently Updated Narratives
RO


RockeTeller on Manuka Resources ·
Manuka Resources Just Restarted Gold, Silver Hits Q4 with $805M NPV vs $152M Cap
Fair Value:AU$4.7998.6% undervalued
11 followersusers have followed this narrative
1 commentusers have commented on this narrative
0 likesusers have liked this narrative
TI

TimLee on Pentech Holdings Berhad ·
Why Pentech Stands Out After 2QFY26
Fair Value:RM 0.5334.0% undervalued
1 followerusers have followed this narrative
0 commentsusers have commented on this narrative
0 likesusers have liked this narrative
CO


Constantin_Mar on Platform Group SE KGaA ·
High risk. Massive upside. I’m betting on execution.
Fair Value:€8.6989.5% undervalued
1 followerusers have followed this narrative
0 commentsusers have commented on this narrative
0 likesusers have liked this narrative
Popular Narratives
AN


AnalystConsensusTarget on NVIDIA ·
NVDA: Expanding AI Demand Will Drive Major Data Center Investments Through 2026
Fair Value:US$302.8327.9% undervalued
1422 followersusers have followed this narrative
8 commentsusers have commented on this narrative
35 likesusers have liked this narrative
AN

AnalystConsensusTarget on Alphabet ·
GOOGL: AI Platform Expansion And Cloud Demand Will Support Durable Performance Amid Competitive Pressures
Fair Value:US$427.8920.9% undervalued
1606 followersusers have followed this narrative
0 commentsusers have commented on this narrative
19 likesusers have liked this narrative
AN

AnalystConsensusTarget on Amazon.com ·
AMZN: Acceleration In Cloud And AI Will Drive Margin Expansion Ahead
Fair Value:US$32721.5% undervalued
1629 followersusers have followed this narrative
1 commentusers have commented on this narrative
16 likesusers have liked this narrative

