
Advertisement

Many investors are still learning about the various metrics that can be useful when analysing a stock. This article is for those who would like to learn about Return On Equity (ROE). We'll use ROE to examine Oeneo SA (EPA:SBT), by way of a worked example.
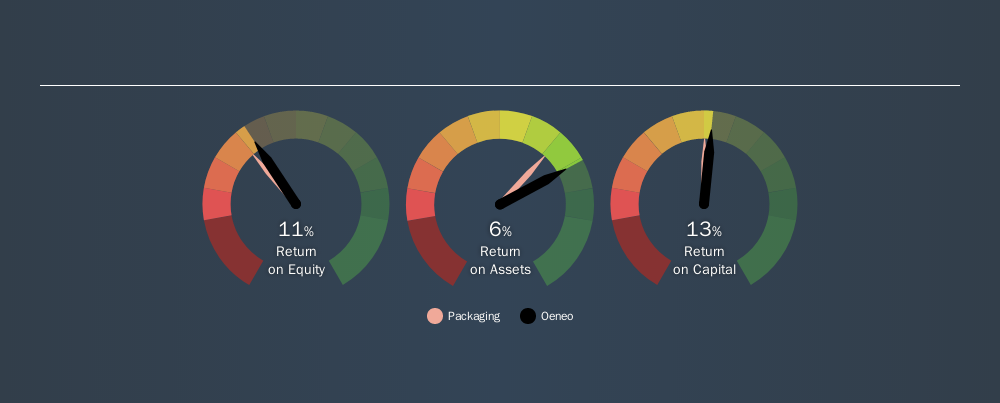
Over the last twelve months Oeneo has recorded a ROE of 11%. Another way to think of that is that for every €1 worth of equity in the company, it was able to earn €0.11.
View our latest analysis for Oeneo
How Do I Calculate Return On Equity?
The formula for return on equity is:
Return on Equity = Net Profit ÷ Shareholders' Equity
Or for Oeneo:
11% = €27m ÷ €256m (Based on the trailing twelve months to March 2019.)
It's easy to understand the 'net profit' part of that equation, but 'shareholders' equity' requires further explanation. It is all earnings retained by the company, plus any capital paid in by shareholders. You can calculate shareholders' equity by subtracting the company's total liabilities from its total assets.
What Does Return On Equity Signify?
ROE measures a company's profitability against the profit it retains, and any outside investments. The 'return' is the yearly profit. That means that the higher the ROE, the more profitable the company is. So, all else being equal, a high ROE is better than a low one. Clearly, then, one can use ROE to compare different companies.
Does Oeneo Have A Good Return On Equity?
By comparing a company's ROE with its industry average, we can get a quick measure of how good it is. Importantly, this is far from a perfect measure, because companies differ significantly within the same industry classification. If you look at the image below, you can see Oeneo has a similar ROE to the average in the Packaging industry classification (9.4%).
That's not overly surprising. ROE doesn't tell us if the share price is low, but it can inform us to the nature of the business. For those looking for a bargain, other factors may be more important. I will like Oeneo better if I see some big insider buys. While we wait, check out this free list of growing companies with considerable, recent, insider buying.
The Importance Of Debt To Return On Equity
Most companies need money -- from somewhere -- to grow their profits. That cash can come from retained earnings, issuing new shares (equity), or debt. In the first two cases, the ROE will capture this use of capital to grow. In the latter case, the debt used for growth will improve returns, but won't affect the total equity. That will make the ROE look better than if no debt was used.
Combining Oeneo's Debt And Its 11% Return On Equity
Oeneo has a debt to equity ratio of 0.36, which is far from excessive. The combination of modest debt and a very respectable ROE suggests this is a business worth watching. Judicious use of debt to improve returns can certainly be a good thing, although it does elevate risk slightly and reduce future optionality.
The Bottom Line On ROE
Return on equity is a useful indicator of the ability of a business to generate profits and return them to shareholders. A company that can achieve a high return on equity without debt could be considered a high quality business. If two companies have the same ROE, then I would generally prefer the one with less debt.
But ROE is just one piece of a bigger puzzle, since high quality businesses often trade on high multiples of earnings. Profit growth rates, versus the expectations reflected in the price of the stock, are a particularly important to consider. So you might want to check this FREE visualization of analyst forecasts for the company.
If you would prefer check out another company -- one with potentially superior financials -- then do not miss thisfree list of interesting companies, that have HIGH return on equity and low debt.
We aim to bring you long-term focused research analysis driven by fundamental data. Note that our analysis may not factor in the latest price-sensitive company announcements or qualitative material.
If you spot an error that warrants correction, please contact the editor at editorial-team@simplywallst.com. This article by Simply Wall St is general in nature. It does not constitute a recommendation to buy or sell any stock, and does not take account of your objectives, or your financial situation. Simply Wall St has no position in the stocks mentioned. Thank you for reading.
About ENXTPA:SBT
Flawless balance sheet with solid track record and pays a dividend.
Market Insights


Advertisement
Community Narratives
The Future of Drug Testing? Fingerprint Tech Shows Serious Promise
Fair Value US$2.98|40.3% undervalued
JO
Community Contributor
Suncorp’s Next Chapter: Insurance-Only and Ready to Grow
Fair Value AU$22.83|7.6% undervalued
RO
Community Contributor
Thyssenkrupp Nucera Will Achieve Double-Digit Profits by 2030 Boosted by Hydrogen Growth
Fair Value €14.40|30.6% undervalued
CH
Community Contributor
Tesla’s Nvidia Moment – The AI & Robotics Inflection Point
Fair Value US$359.72|12.3% undervalued
BL
Community Contributor