Advertisement
- United Kingdom
- /
- Professional Services
- /
- LSE:DWF
What Is DWF Group's (LON:DWF) P/E Ratio After Its Share Price Tanked?
To the annoyance of some shareholders, DWF Group (LON:DWF) shares are down a considerable 37% in the last month. The recent drop has obliterated the annual return, with the share price now down 28% over that longer period.
All else being equal, a share price drop should make a stock more attractive to potential investors. In the long term, share prices tend to follow earnings per share, but in the short term prices bounce around in response to short term factors (which are not always obvious). So, on certain occasions, long term focussed investors try to take advantage of pessimistic expectations to buy shares at a better price. Perhaps the simplest way to get a read on investors' expectations of a business is to look at its Price to Earnings Ratio (PE Ratio). A high P/E implies that investors have high expectations of what a company can achieve compared to a company with a low P/E ratio.
See our latest analysis for DWF Group
Does DWF Group Have A Relatively High Or Low P/E For Its Industry?
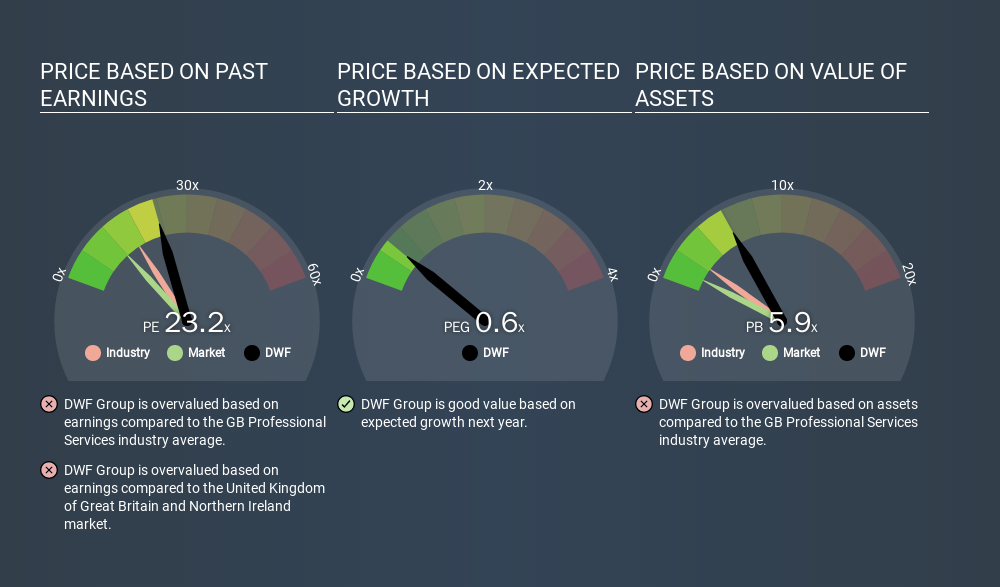
We can tell from its P/E ratio of 23.20 that there is some investor optimism about DWF Group. As you can see below, DWF Group has a higher P/E than the average company (14.6) in the professional services industry.
That means that the market expects DWF Group will outperform other companies in its industry. Shareholders are clearly optimistic, but the future is always uncertain. So investors should always consider the P/E ratio alongside other factors, such as whether company directors have been buying shares.
How Growth Rates Impact P/E Ratios
Generally speaking the rate of earnings growth has a profound impact on a company's P/E multiple. If earnings are growing quickly, then the 'E' in the equation will increase faster than it would otherwise. That means unless the share price increases, the P/E will reduce in a few years. And as that P/E ratio drops, the company will look cheap, unless its share price increases.
It's nice to see that DWF Group grew EPS by a stonking 48% in the last year.
A Limitation: P/E Ratios Ignore Debt and Cash In The Bank
The 'Price' in P/E reflects the market capitalization of the company. Thus, the metric does not reflect cash or debt held by the company. The exact same company would hypothetically deserve a higher P/E ratio if it had a strong balance sheet, than if it had a weak one with lots of debt, because a cashed up company can spend on growth.
Such spending might be good or bad, overall, but the key point here is that you need to look at debt to understand the P/E ratio in context.
So What Does DWF Group's Balance Sheet Tell Us?
DWF Group's net debt is 19% of its market cap. This could bring some additional risk, and reduce the number of investment options for management; worth remembering if you compare its P/E to businesses without debt.
The Verdict On DWF Group's P/E Ratio
DWF Group's P/E is 23.2 which is above average (11.2) in its market. Its debt levels do not imperil its balance sheet and its EPS growth is very healthy indeed. So to be frank we are not surprised it has a high P/E ratio. Given DWF Group's P/E ratio has declined from 37.0 to 23.2 in the last month, we know for sure that the market is significantly less confident about the business today, than it was back then. For those who don't like to trade against momentum, that could be a warning sign, but a contrarian investor might want to take a closer look.
When the market is wrong about a stock, it gives savvy investors an opportunity. As value investor Benjamin Graham famously said, 'In the short run, the market is a voting machine but in the long run, it is a weighing machine. So this free visual report on analyst forecasts could hold the key to an excellent investment decision.
You might be able to find a better buy than DWF Group. If you want a selection of possible winners, check out this free list of interesting companies that trade on a P/E below 20 (but have proven they can grow earnings).
If you spot an error that warrants correction, please contact the editor at editorial-team@simplywallst.com. This article by Simply Wall St is general in nature. It does not constitute a recommendation to buy or sell any stock, and does not take account of your objectives, or your financial situation. Simply Wall St has no position in the stocks mentioned.
We aim to bring you long-term focused research analysis driven by fundamental data. Note that our analysis may not factor in the latest price-sensitive company announcements or qualitative material. Thank you for reading.
About LSE:DWF
DWF Group
DWF Group plc provides integrated legal and business services in Europe, the Middle East, Asia, Australia, and North America.
Adequate balance sheet and fair value.
Market Insights


Advertisement
Weekly Picks
CE


Ceazar on Conexeu Sciences ·
This small biotech is developing technology that could potentially change how tissue is rebuilt
Fair Value:US$25.3448.6% undervalued
19 followersusers have followed this narrative
0 commentsusers have commented on this narrative
1 likeusers have liked this narrative
HE


HedgeY on Quanta Services ·
The Picks-and-Shovels Leader of the Grid Supercycle
Fair Value:US$7100.7% overvalued
42 followersusers have followed this narrative
0 commentsusers have commented on this narrative
4 likesusers have liked this narrative
FU

FundamentalFlow on Karman Holdings ·
KRMN — Karman Space & Defense: Down 58% from Peak, Is the Market Mispricing a Hypergrowth Defense Compounder?
Fair Value:US$105.650.7% undervalued
22 followersusers have followed this narrative
1 commentusers have commented on this narrative
12 likesusers have liked this narrative
DO


Double_Bubbler on Invinity Energy Systems ·
Invinity Energy Systems: All About That BESS
Fair Value:UK£162.0% undervalued
30 followersusers have followed this narrative
0 commentsusers have commented on this narrative
5 likesusers have liked this narrative
Recently Updated Narratives
PU


Pure_Research on Micron Technology ·
Strategic and Financial Blueprint of Micron Technology: Resolving the Memory Wall in the Gen-AI Era
Fair Value:US$2.02k48.3% undervalued
3 followersusers have followed this narrative
0 commentsusers have commented on this narrative
0 likesusers have liked this narrative
NI

niteco on Palantir Technologies ·
Palantir: Operating System for Government and Regulated Industry AI
Fair Value:US$361.5863.9% undervalued
10 followersusers have followed this narrative
2 commentsusers have commented on this narrative
0 likesusers have liked this narrative
LE

lenny67 on Renforth Resources ·
The Strategic Arbitrage at Parbec: Why Renforth Holds the Cards
Fair Value:CA$0.1583.3% undervalued
0 followersusers have followed this narrative
0 commentsusers have commented on this narrative
0 likesusers have liked this narrative
Popular Narratives
MA


martinarauz on Nu Holdings ·
Investment Analysis (May 2026)
Fair Value:US$22.7443.3% undervalued
66 followersusers have followed this narrative
0 commentsusers have commented on this narrative
16 likesusers have liked this narrative
HA


HarishPK on Adobe ·
Adobe: A Probabilistic Case for Undervaluation
Fair Value:US$319.9638.7% undervalued
56 followersusers have followed this narrative
8 commentsusers have commented on this narrative
17 likesusers have liked this narrative
NI

niteco on Honeywell International ·
Honeywell - The Demand-Side of the AI Infrastructure
Fair Value:US$320.1928.6% undervalued
51 followersusers have followed this narrative
0 commentsusers have commented on this narrative
19 likesusers have liked this narrative
Trending Discussion
AC


ACV on Alignment Healthcare ·
high medical loss ratios, and negative free cash flow signal that scaling profitably remains elusive...
0
|0
