
Advertisement
The goal of this article is to teach you how to use price to earnings ratios (P/E ratios). We'll show how you can use Wipro Limited's (NSE:WIPRO) P/E ratio to inform your assessment of the investment opportunity. Looking at earnings over the last twelve months, Wipro has a P/E ratio of 11.81. That means that at current prices, buyers pay ₹11.81 for every ₹1 in trailing yearly profits.
Check out our latest analysis for Wipro
How Do You Calculate Wipro's P/E Ratio?
The formula for P/E is:
Price to Earnings Ratio = Share Price ÷ Earnings per Share (EPS)
Or for Wipro:
P/E of 11.81 = ₹197.400 ÷ ₹16.709 (Based on the year to December 2019.)
(Note: the above calculation results may not be precise due to rounding.)
Is A High Price-to-Earnings Ratio Good?
A higher P/E ratio means that buyers have to pay a higher price for each ₹1 the company has earned over the last year. That is not a good or a bad thing per se, but a high P/E does imply buyers are optimistic about the future.
How Does Wipro's P/E Ratio Compare To Its Peers?
One good way to get a quick read on what market participants expect of a company is to look at its P/E ratio. As you can see below, Wipro has a higher P/E than the average company (8.7) in the it industry.
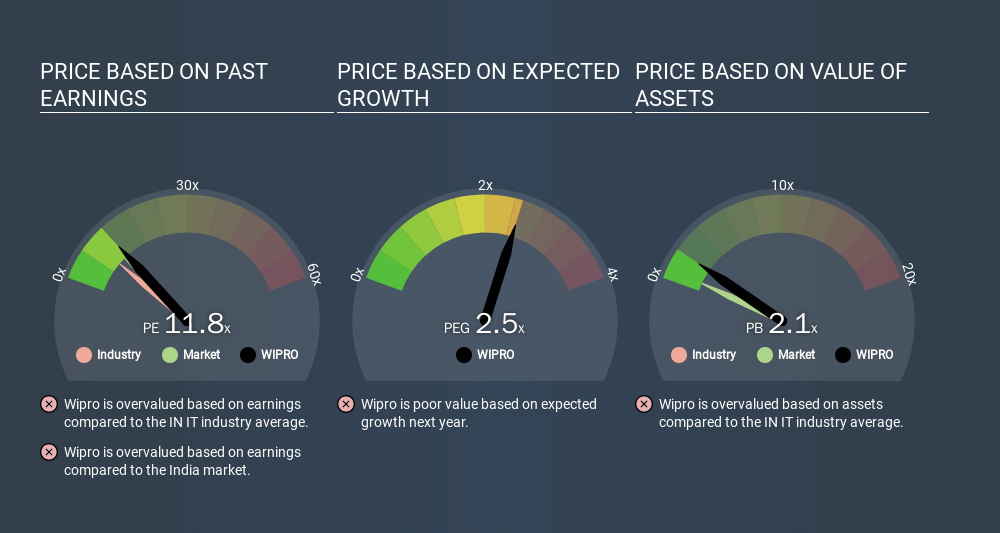
Wipro's P/E tells us that market participants think the company will perform better than its industry peers, going forward. Clearly the market expects growth, but it isn't guaranteed. So investors should always consider the P/E ratio alongside other factors, such as whether company directors have been buying shares.
How Growth Rates Impact P/E Ratios
Probably the most important factor in determining what P/E a company trades on is the earnings growth. When earnings grow, the 'E' increases, over time. Therefore, even if you pay a high multiple of earnings now, that multiple will become lower in the future. A lower P/E should indicate the stock is cheap relative to others -- and that may attract buyers.
Most would be impressed by Wipro earnings growth of 21% in the last year. And its annual EPS growth rate over 5 years is 4.9%. This could arguably justify a relatively high P/E ratio.
Remember: P/E Ratios Don't Consider The Balance Sheet
Don't forget that the P/E ratio considers market capitalization. Thus, the metric does not reflect cash or debt held by the company. The exact same company would hypothetically deserve a higher P/E ratio if it had a strong balance sheet, than if it had a weak one with lots of debt, because a cashed up company can spend on growth.
Such spending might be good or bad, overall, but the key point here is that you need to look at debt to understand the P/E ratio in context.
Wipro's Balance Sheet
Wipro has net cash of ₹258b. This is fairly high at 23% of its market capitalization. That might mean balance sheet strength is important to the business, but should also help push the P/E a bit higher than it would otherwise be.
The Bottom Line On Wipro's P/E Ratio
Wipro trades on a P/E ratio of 11.8, which is above its market average of 10.8. With cash in the bank the company has plenty of growth options -- and it is already on the right track. So it is not surprising the market is probably extrapolating recent growth well into the future, reflected in the relatively high P/E ratio.
Investors have an opportunity when market expectations about a stock are wrong. If the reality for a company is better than it expects, you can make money by buying and holding for the long term. So this free visual report on analyst forecasts could hold the key to an excellent investment decision.
Of course you might be able to find a better stock than Wipro. So you may wish to see this free collection of other companies that have grown earnings strongly.
If you spot an error that warrants correction, please contact the editor at editorial-team@simplywallst.com. This article by Simply Wall St is general in nature. It does not constitute a recommendation to buy or sell any stock, and does not take account of your objectives, or your financial situation. Simply Wall St has no position in the stocks mentioned.
We aim to bring you long-term focused research analysis driven by fundamental data. Note that our analysis may not factor in the latest price-sensitive company announcements or qualitative material. Thank you for reading.
About NSEI:WIPRO
Wipro
Operates as an information technology (IT), consulting, and business process services company worldwide.
Excellent balance sheet established dividend payer.
Similar Companies
Market Insights



Advertisement
Weekly Picks
CE


Ceazar on Sparc AI ·
When GPS fails: this small cap is fixing a $54B drone problem
Fair Value:CA$5.2552.0% undervalued
137 followersusers have followed this narrative
0 commentsusers have commented on this narrative
26 likesusers have liked this narrative
BL

BlackGoat on IREN ·
IREN's Bold Moves in Sustainable Bitcoin Mining & AI Data Centers
Fair Value:US$71.4848.5% undervalued
227 followersusers have followed this narrative
10 commentsusers have commented on this narrative
33 likesusers have liked this narrative
HE


HedgeY on Arm Holdings ·
The Architecture Layer of AI Computing - But Priced Like the Future Already Arrived?
Fair Value:US$43044.3% undervalued
31 followersusers have followed this narrative
1 commentusers have commented on this narrative
8 likesusers have liked this narrative
HI


Hidden_Rock_Capital on Fiserv ·
Temporary "perfect storm" leads to opportunity to buy financial services leader for less than 5x long-term earnings
Fair Value:US$119.9955.0% undervalued
39 followersusers have followed this narrative
1 commentusers have commented on this narrative
11 likesusers have liked this narrative
Recently Updated Narratives
DZ

Dzitkowskik on Vonovia ·
Vonovia – Asymmetric Upside from Balance Sheet Repair
Fair Value:€27.4823.5% undervalued
1 followerusers have followed this narrative
0 commentsusers have commented on this narrative
0 likesusers have liked this narrative
RC

rcb9 on Colgate-Palmolive ·
The Ten Percent Margin Is A Write Down, Not The Business
Fair Value:US$86.485.6% overvalued
1 followerusers have followed this narrative
0 commentsusers have commented on this narrative
0 likesusers have liked this narrative
RC

rcb9 on Apple ·
Strip Out The Refunds And The Quarter Was In Line
Fair Value:US$279.9910.3% overvalued
1 followerusers have followed this narrative
0 commentsusers have commented on this narrative
0 likesusers have liked this narrative
Popular Narratives
OS


oscargarcia on NVIDIA ·
The company that went from selling GPUs to gamers to becoming the AI arms dealer of the 21st century.
Fair Value:US$28028.3% undervalued
237 followersusers have followed this narrative
9 commentsusers have commented on this narrative
16 likesusers have liked this narrative
CU

CubanEros on Microsoft ·
A wonderful business at reasonable price.
Fair Value:US$419.9110.7% overvalued
113 followersusers have followed this narrative
0 commentsusers have commented on this narrative
7 likesusers have liked this narrative
TR


tripledub on Alphabet ·
Warren Buffett Just Bet $10 Billion on Google. The Catch? You May Already Be Too Late.
Fair Value:US$202.6275.8% overvalued
125 followersusers have followed this narrative
1 commentusers have commented on this narrative
18 likesusers have liked this narrative
Trending Discussion
GR
greg_xasak on Fiserv ·
As someone who has dealt directly with them as a CTO for a credit union, I have 8 years of horror stories about doing business with them. If there was any other competitor than could deliver 80% of Fiserv services, there would be a mad rush to migrate to them. They should thank their lucky stars they are a near monopoly. this industry is so ripe for a well funded competitor. Their integration of technology is awful, their ability to fix their own implementation screwups is sadly tragic. Sometimes they just silently kill support tickets without resolution and you never find out until you do a follow up inquiry. Why, because sometimes no one you are dealing with knows how to fix it and knows no one to ask for help. They can not meet their own implementation deadlines and sometimes there is no one on a technical team dealing with you that has any banking or credit union experience. The is an industry insider phrase when you meet other Fiserv customers called being "Fiserved". It means telling others of your worst stories of dealing with them. Ask around, all CTO's have some doozies.
4
|0

FU

FundamentalFlow on Green Tea Group ·
Great narrative! Many people focus on AI nowadays (including me), and it's refreshing to see a deep dive into the fundamentals of a business like Green Tea. I really appreciate how you cut through the market noise to focus on the unit economics and the structural risks.I also write from a fundamentals-first perspective, and I'm currently working on an analysis of Samsung Electronics. I've been trying to refine how I balance factors such as financial health, future, and valuation of a company.If you have a moment, I'd love for you to take a look at my narritives. I'd value your perspective on whether my analysis holds up to the level of rigor you set here. No pressure at all, but I'd appreciate the feedback if you're open to it!
1
|0