

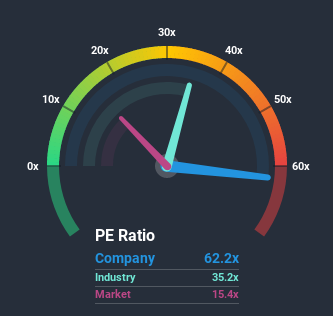
Boyd Group Services Inc.'s (TSE:BYD) price-to-earnings (or "P/E") ratio of 62.2x might make it look like a strong sell right now compared to the market in Canada, where around half of the companies have P/E ratios below 15x and even P/E's below 7x are quite common. However, the P/E might be quite high for a reason and it requires further investigation to determine if it's justified.
Boyd Group Services has been struggling lately as its earnings have declined faster than most other companies. It might be that many expect the dismal earnings performance to recover substantially, which has kept the P/E from collapsing. You'd really hope so, otherwise you're paying a pretty hefty price for no particular reason.
Check out our latest analysis for Boyd Group Services
What Are Growth Metrics Telling Us About The High P/E?
The only time you'd be truly comfortable seeing a P/E as steep as Boyd Group Services' is when the company's growth is on track to outshine the market decidedly.
If we review the last year of earnings, dishearteningly the company's profits fell to the tune of 20%. However, a few very strong years before that means that it was still able to grow EPS by an impressive 31% in total over the last three years. So we can start by confirming that the company has generally done a very good job of growing earnings over that time, even though it had some hiccups along the way.
Looking ahead now, EPS is anticipated to slump, contracting by 29% during the coming year according to the analysts following the company. With the market predicted to deliver 3.9% growth , that's a disappointing outcome.
In light of this, it's alarming that Boyd Group Services' P/E sits above the majority of other companies. It seems most investors are hoping for a turnaround in the company's business prospects, but the analyst cohort is not so confident this will happen. There's a very good chance these shareholders are setting themselves up for future disappointment if the P/E falls to levels more in line with the negative growth outlook.
What We Can Learn From Boyd Group Services' P/E?
Typically, we'd caution against reading too much into price-to-earnings ratios when settling on investment decisions, though it can reveal plenty about what other market participants think about the company.
Our examination of Boyd Group Services' analyst forecasts revealed that its outlook for shrinking earnings isn't impacting its high P/E anywhere near as much as we would have predicted. Right now we are increasingly uncomfortable with the high P/E as the predicted future earnings are highly unlikely to support such positive sentiment for long. This places shareholders' investments at significant risk and potential investors in danger of paying an excessive premium.
Plus, you should also learn about these 4 warning signs we've spotted with Boyd Group Services.
Of course, you might also be able to find a better stock than Boyd Group Services. So you may wish to see this free collection of other companies that sit on P/E's below 20x and have grown earnings strongly.
If you decide to trade Boyd Group Services, use the lowest-cost* platform that is rated #1 Overall by Barron’s, Interactive Brokers. Trade stocks, options, futures, forex, bonds and funds on 135 markets, all from a single integrated account. Promoted
Valuation is complex, but we're here to simplify it.
Discover if Boyd Group Services might be undervalued or overvalued with our detailed analysis, featuring fair value estimates, potential risks, dividends, insider trades, and its financial condition.
Access Free AnalysisThis article by Simply Wall St is general in nature. It does not constitute a recommendation to buy or sell any stock, and does not take account of your objectives, or your financial situation. We aim to bring you long-term focused analysis driven by fundamental data. Note that our analysis may not factor in the latest price-sensitive company announcements or qualitative material. Simply Wall St has no position in any stocks mentioned.
*Interactive Brokers Rated Lowest Cost Broker by StockBrokers.com Annual Online Review 2020
Have feedback on this article? Concerned about the content? Get in touch with us directly. Alternatively, email editorial-team@simplywallst.com.
About TSX:BYD
Boyd Group Services
Operates non-franchised collision repair centers in North America.
Reasonable growth potential and fair value.
Market Insights

Community Narratives

