- United Kingdom
- /
- Capital Markets
- /
- AIM:BPM
Top UK Dividend Stocks To Consider In September 2025

Reviewed by Simply Wall St
As the FTSE 100 index faces headwinds from weak trade data out of China, investors are closely watching how these global economic challenges impact the UK market. In such uncertain times, dividend stocks can offer a measure of stability and income, making them an attractive option for those looking to navigate volatile markets while seeking regular returns.
Top 10 Dividend Stocks In The United Kingdom
| Name | Dividend Yield | Dividend Rating |
| Treatt (LSE:TET) | 3.19% | ★★★★★☆ |
| Seplat Energy (LSE:SEPL) | 6.11% | ★★★★★☆ |
| RS Group (LSE:RS1) | 3.94% | ★★★★★☆ |
| Pets at Home Group (LSE:PETS) | 5.78% | ★★★★★★ |
| OSB Group (LSE:OSB) | 6.05% | ★★★★★☆ |
| NWF Group (AIM:NWF) | 4.86% | ★★★★★☆ |
| MONY Group (LSE:MONY) | 6.21% | ★★★★★★ |
| Keller Group (LSE:KLR) | 3.74% | ★★★★★☆ |
| IG Group Holdings (LSE:IGG) | 4.14% | ★★★★★☆ |
| 4imprint Group (LSE:FOUR) | 5.31% | ★★★★★☆ |
Click here to see the full list of 51 stocks from our Top UK Dividend Stocks screener.
Below we spotlight a couple of our favorites from our exclusive screener.
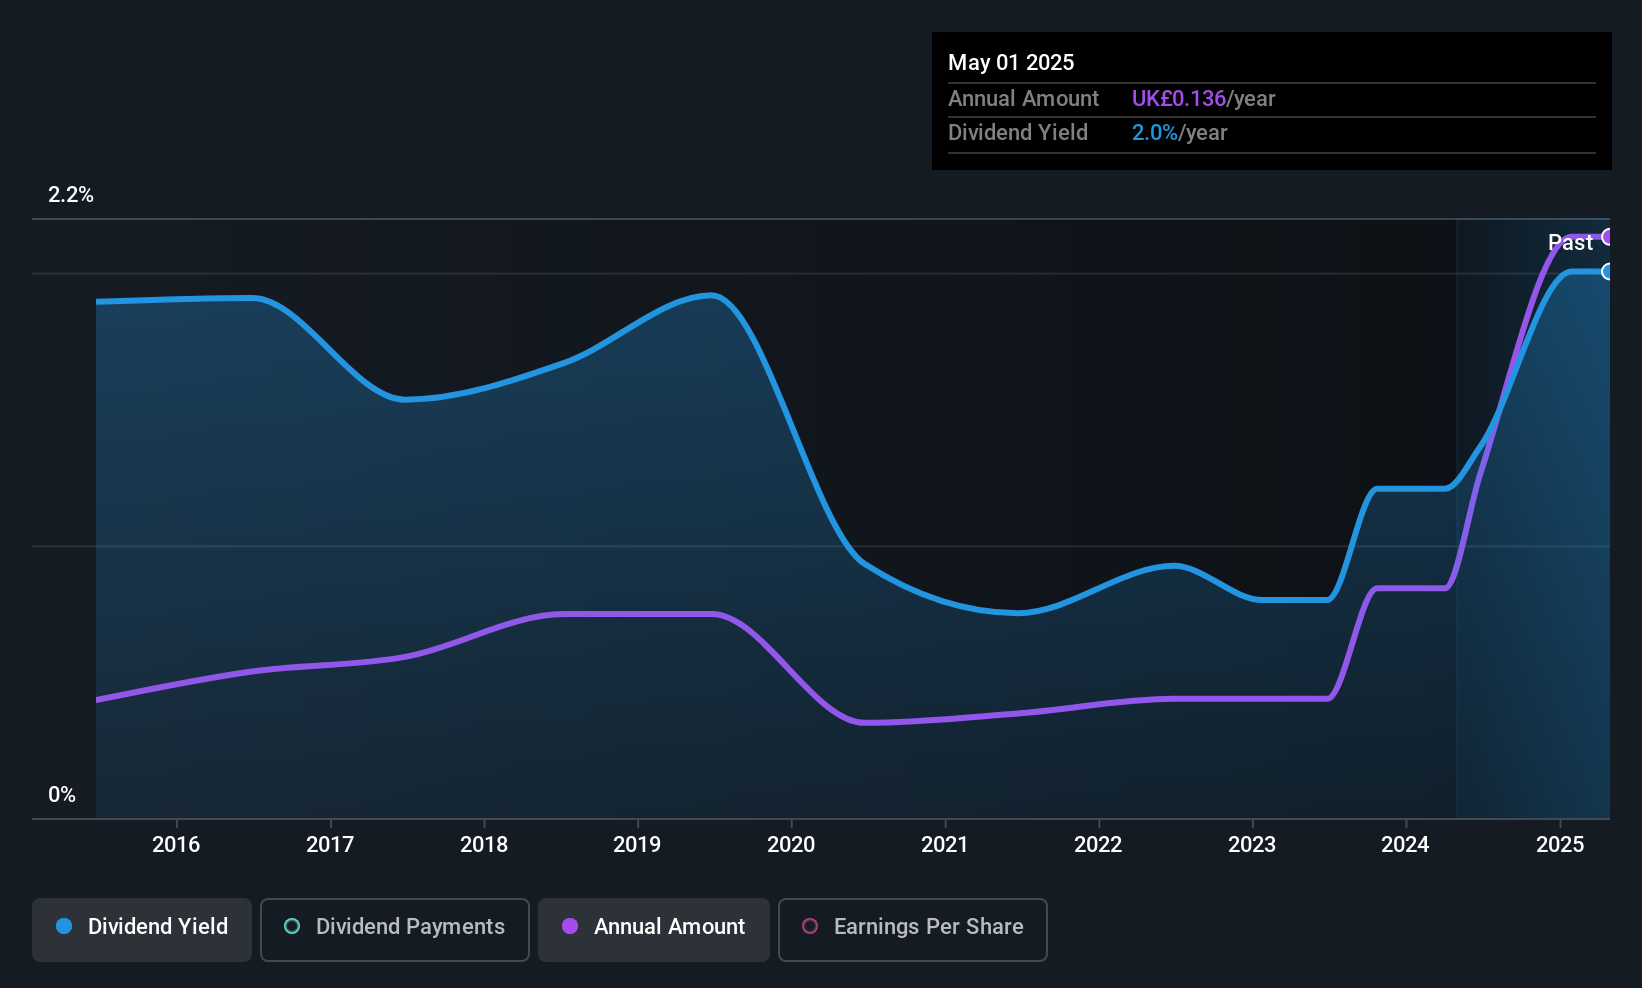
B.P. Marsh & Partners (AIM:BPM)
Simply Wall St Dividend Rating: ★★★★☆☆
Overview: B.P. Marsh & Partners PLC invests in early-stage and SME financial services intermediary businesses both in the United Kingdom and internationally, with a market cap of £250.49 million.
Operations: B.P. Marsh & Partners PLC generates revenue of £115.24 million from providing consultancy services and trading investments in financial services.
Dividend Yield: 3.1%
B.P. Marsh & Partners' dividends are well covered by both earnings and cash flows, with low payout ratios of 5% and 23.4%, respectively. However, its dividend history is marked by volatility and unreliability over the past decade, despite recent growth in payments. The dividend yield of 3.12% is below the top tier in the UK market. Recent equity offerings totaling £23.57 million could impact future dividend stability or growth prospects due to potential dilution effects on earnings per share.
- Click to explore a detailed breakdown of our findings in B.P. Marsh & Partners' dividend report.
- Our expertly prepared valuation report B.P. Marsh & Partners implies its share price may be lower than expected.
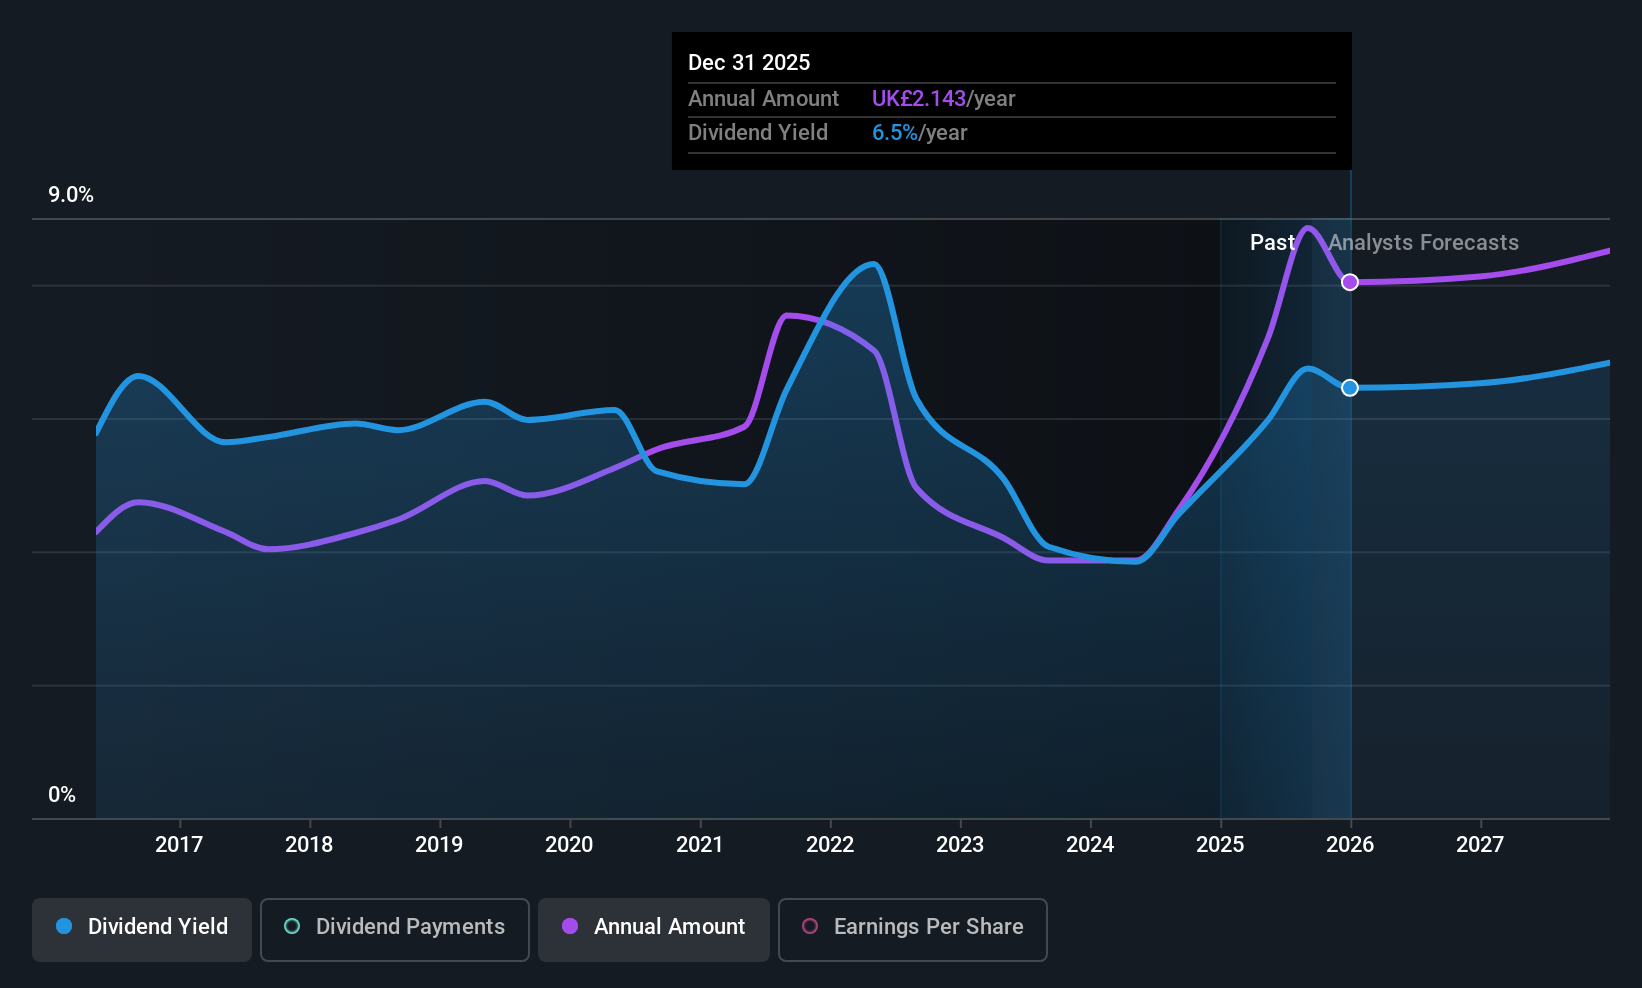
Admiral Group (LSE:ADM)
Simply Wall St Dividend Rating: ★★★★☆☆
Overview: Admiral Group plc is a financial services company offering insurance and personal lending products across the UK, France, Italy, Spain, and the US with a market cap of £10.07 billion.
Operations: Admiral Group plc generates revenue primarily from its UK Insurance segment (£4.33 billion) and Admiral Money (£20.10 million).
Dividend Yield: 7.1%
Admiral Group's dividend yield of 7.1% ranks in the top quartile among UK payers, yet its dividends have been volatile and unreliable over the past decade. Despite a reasonable payout ratio of 65.1%, high cash payout ratios indicate dividends are not well covered by cash flows, raising sustainability concerns. Recent earnings growth—net income increased to £401 million for H1 2025—offers some optimism, although future earnings are forecasted to decline slightly.
- Click here to discover the nuances of Admiral Group with our detailed analytical dividend report.
- Insights from our recent valuation report point to the potential undervaluation of Admiral Group shares in the market.
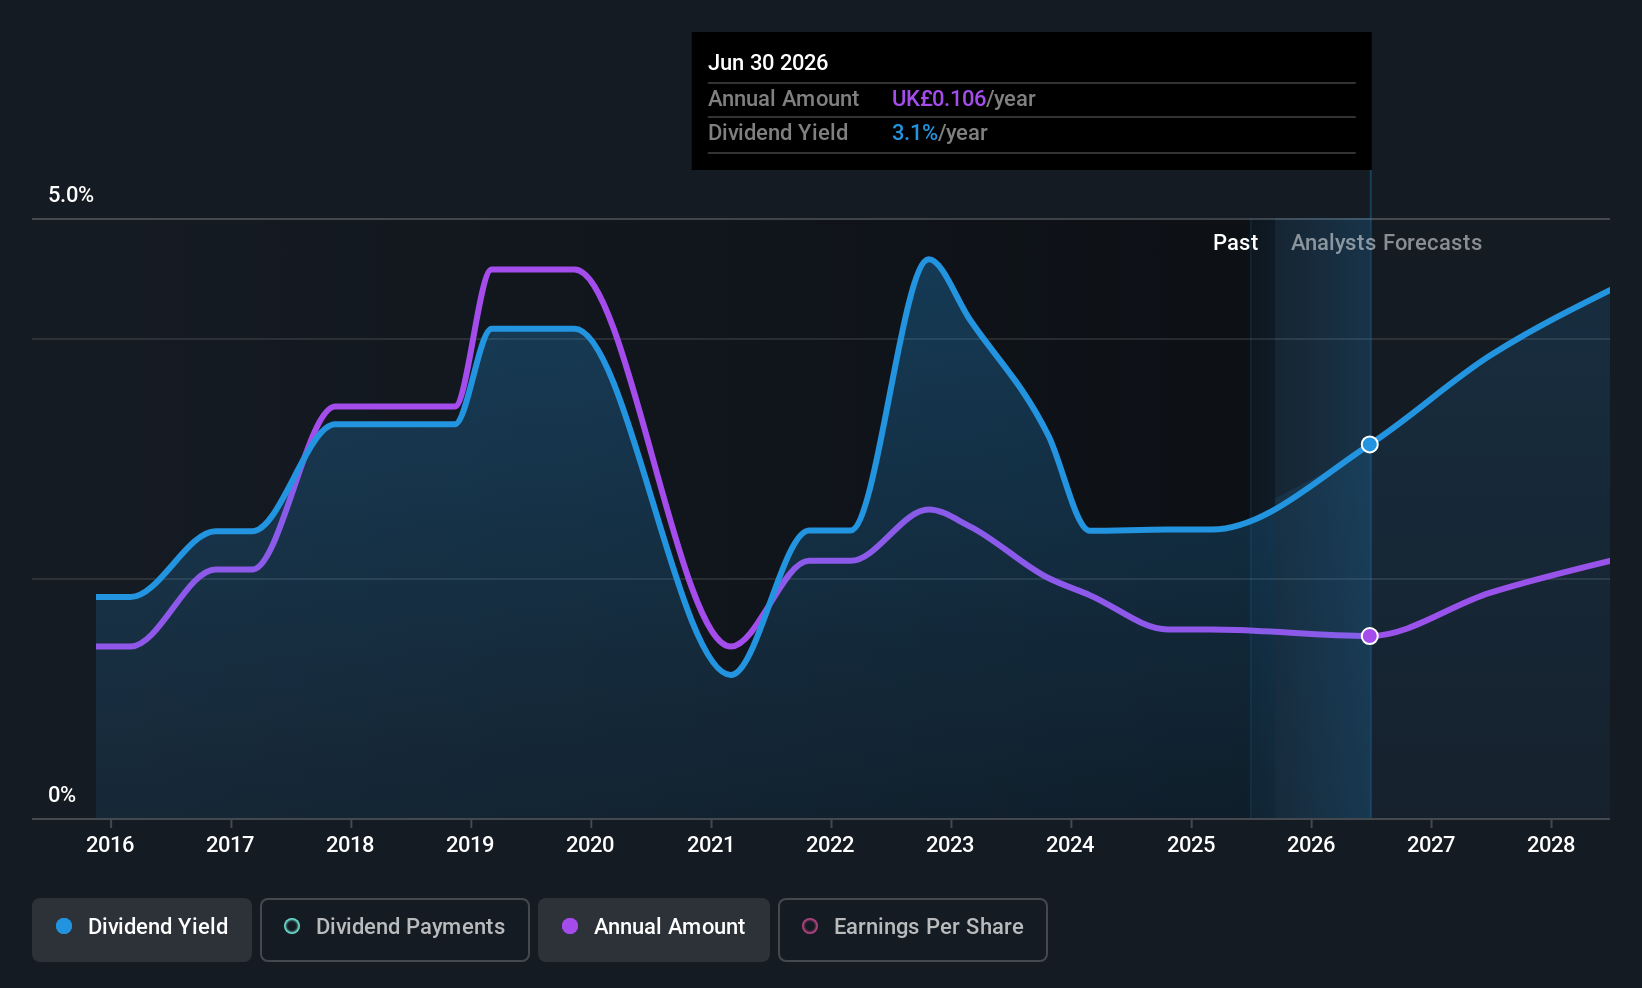
MJ Gleeson (LSE:GLE)
Simply Wall St Dividend Rating: ★★★★☆☆
Overview: MJ Gleeson plc operates in the United Kingdom focusing on house building and land promotion and sales, with a market cap of £199.26 million.
Operations: MJ Gleeson plc generates revenue from its operations in the United Kingdom through two main segments: Gleeson Homes, contributing £343.33 million, and Gleeson Land, contributing £8.40 million.
Dividend Yield: 3.2%
MJ Gleeson's dividend payments have grown over the past decade but remain volatile and unreliable. With a payout ratio of 38.8%, dividends are well covered by earnings, though cash flow coverage is less robust at 79.2%. The stock trades at a favorable price-to-earnings ratio of 12.1x compared to the UK market average, suggesting good relative value. Recent guidance projects profit before tax for fiscal year 2025 within market expectations, despite leadership changes in July 2025.
- Get an in-depth perspective on MJ Gleeson's performance by reading our dividend report here.
- The valuation report we've compiled suggests that MJ Gleeson's current price could be quite moderate.
Seize The Opportunity
- Click here to access our complete index of 51 Top UK Dividend Stocks.
- Invested in any of these stocks? Simplify your portfolio management with Simply Wall St and stay ahead with our alerts for any critical updates on your stocks.
- Unlock the power of informed investing with Simply Wall St, your free guide to navigating stock markets worldwide.
Searching for a Fresh Perspective?
- Explore high-performing small cap companies that haven't yet garnered significant analyst attention.
- Fuel your portfolio with companies showing strong growth potential, backed by optimistic outlooks both from analysts and management.
- Find companies with promising cash flow potential yet trading below their fair value.
This article by Simply Wall St is general in nature. We provide commentary based on historical data and analyst forecasts only using an unbiased methodology and our articles are not intended to be financial advice. It does not constitute a recommendation to buy or sell any stock, and does not take account of your objectives, or your financial situation. We aim to bring you long-term focused analysis driven by fundamental data. Note that our analysis may not factor in the latest price-sensitive company announcements or qualitative material. Simply Wall St has no position in any stocks mentioned.
Mobile Infrastructure for Defense and Disaster
The next wave in robotics isn't humanoid. Its fully autonomous towers delivering 5G, ISR, and radar in under 30 minutes, anywhere.
Get the investor briefing before the next round of contracts
Sponsored On Behalf of CiTechValuation is complex, but we're here to simplify it.
Discover if B.P. Marsh & Partners might be undervalued or overvalued with our detailed analysis, featuring fair value estimates, potential risks, dividends, insider trades, and its financial condition.
Access Free AnalysisHave feedback on this article? Concerned about the content? Get in touch with us directly. Alternatively, email editorial-team@simplywallst.com
About AIM:BPM
B.P. Marsh & Partners
Invests in early-stage and SME financial services intermediary businesses in the United Kingdom and internationally.
Flawless balance sheet with solid track record.
Market Insights

Weekly Picks

Early mover in a fast growing industry. Likely to experience share price volatility as they scale


A case for CA$31.80 (undiluted), aka 8,616% upside from CA$0.37 (an 86 bagger!).


Moderation and Stabilisation: HOLD: Fair Price based on a 4-year Cycle is $12.08
Recently Updated Narratives


Title: Market Sentiment Is Dead Wrong — Here's Why PSEC Deserves a Second Look


An amazing opportunity to potentially get a 100 bagger

Amazon: Why the World’s Biggest Platform Still Runs on Invisible Economics
Popular Narratives


Crazy Undervalued 42 Baggers Silver Play (Active & Running Mine)


MicroVision will explode future revenue by 380.37% with a vision towards success


NVDA: Expanding AI Demand Will Drive Major Data Center Investments Through 2026
Trending Discussion
