Advertisement
- United Kingdom
- /
- Construction
- /
- LSE:KIE
These 4 Measures Indicate That Kier Group (LON:KIE) Is Using Debt Extensively
Some say volatility, rather than debt, is the best way to think about risk as an investor, but Warren Buffett famously said that 'Volatility is far from synonymous with risk'. It's only natural to consider a company's balance sheet when you examine how risky it is, since debt is often involved when a business collapses. As with many other companies Kier Group plc (LON:KIE) makes use of debt. But should shareholders be worried about its use of debt?
What Risk Does Debt Bring?
Debt and other liabilities become risky for a business when it cannot easily fulfill those obligations, either with free cash flow or by raising capital at an attractive price. Part and parcel of capitalism is the process of 'creative destruction' where failed businesses are mercilessly liquidated by their bankers. However, a more common (but still painful) scenario is that it has to raise new equity capital at a low price, thus permanently diluting shareholders. Of course, debt can be an important tool in businesses, particularly capital heavy businesses. The first thing to do when considering how much debt a business uses is to look at its cash and debt together.
View our latest analysis for Kier Group
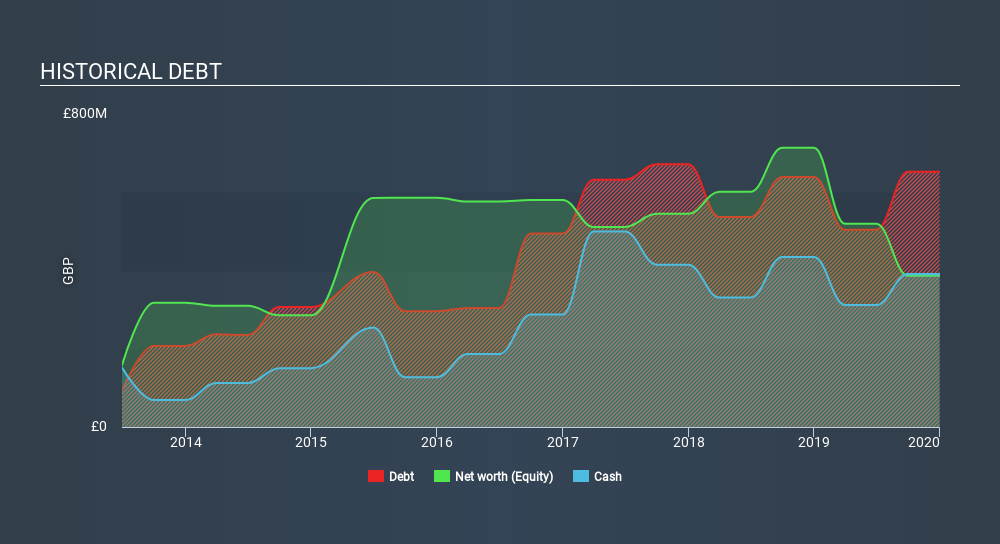
How Much Debt Does Kier Group Carry?
As you can see below, Kier Group had UK£652.1m of debt, at December 2019, which is about the same as the year before. You can click the chart for greater detail. However, it also had UK£390.8m in cash, and so its net debt is UK£261.3m.
A Look At Kier Group's Liabilities
According to the last reported balance sheet, Kier Group had liabilities of UK£1.34b due within 12 months, and liabilities of UK£927.1m due beyond 12 months. Offsetting these obligations, it had cash of UK£390.8m as well as receivables valued at UK£727.4m due within 12 months. So its liabilities outweigh the sum of its cash and (near-term) receivables by UK£1.15b.
The deficiency here weighs heavily on the UK£132.6m company itself, as if a child were struggling under the weight of an enormous back-pack full of books, his sports gear, and a trumpet. So we'd watch its balance sheet closely, without a doubt. After all, Kier Group would likely require a major re-capitalisation if it had to pay its creditors today.
We measure a company's debt load relative to its earnings power by looking at its net debt divided by its earnings before interest, tax, depreciation, and amortization (EBITDA) and by calculating how easily its earnings before interest and tax (EBIT) cover its interest expense (interest cover). The advantage of this approach is that we take into account both the absolute quantum of debt (with net debt to EBITDA) and the actual interest expenses associated with that debt (with its interest cover ratio).
Kier Group has net debt worth 1.7 times EBITDA, which isn't too much, but its interest cover looks a bit on the low side, with EBIT at only 4.0 times the interest expense. While these numbers do not alarm us, it's worth noting that the cost of the company's debt is having a real impact. Pleasingly, Kier Group is growing its EBIT faster than former Australian PM Bob Hawke downs a yard glass, boasting a 131% gain in the last twelve months. There's no doubt that we learn most about debt from the balance sheet. But it is future earnings, more than anything, that will determine Kier Group's ability to maintain a healthy balance sheet going forward. So if you're focused on the future you can check out this free report showing analyst profit forecasts.
Finally, a company can only pay off debt with cold hard cash, not accounting profits. So the logical step is to look at the proportion of that EBIT that is matched by actual free cash flow. Over the last three years, Kier Group recorded negative free cash flow, in total. Debt is usually more expensive, and almost always more risky in the hands of a company with negative free cash flow. Shareholders ought to hope for an improvement.
Our View
On the face of it, Kier Group's conversion of EBIT to free cash flow left us tentative about the stock, and its level of total liabilities was no more enticing than the one empty restaurant on the busiest night of the year. But at least it's pretty decent at growing its EBIT; that's encouraging. Looking at the bigger picture, it seems clear to us that Kier Group's use of debt is creating risks for the company. If all goes well, that should boost returns, but on the flip side, the risk of permanent capital loss is elevated by the debt. There's no doubt that we learn most about debt from the balance sheet. However, not all investment risk resides within the balance sheet - far from it. For example, we've discovered 1 warning sign for Kier Group that you should be aware of before investing here.
When all is said and done, sometimes its easier to focus on companies that don't even need debt. Readers can access a list of growth stocks with zero net debt 100% free, right now.
Love or hate this article? Concerned about the content? Get in touch with us directly. Alternatively, email editorial-team@simplywallst.com.
This article by Simply Wall St is general in nature. It does not constitute a recommendation to buy or sell any stock, and does not take account of your objectives, or your financial situation. We aim to bring you long-term focused analysis driven by fundamental data. Note that our analysis may not factor in the latest price-sensitive company announcements or qualitative material. Simply Wall St has no position in any stocks mentioned. Thank you for reading.
About LSE:KIE
Kier Group
Primarily engages in the construction business in the United Kingdom and internationally.
Undervalued with excellent balance sheet.
Similar Companies
Market Insights


Advertisement
Weekly Picks
LO


Lou_Basenese on Virtuix Holdings ·
From a “Shark Tank” Snub to an Air Force “Yes”: Why Virtuix at $3.50 May Be the Market’s Most Mispriced AI Story
Fair Value:US$7.558.3% undervalued
15 followersusers have followed this narrative
0 commentsusers have commented on this narrative
2 likesusers have liked this narrative
IN


Investingwilly on Mastercard ·
Mastercard: The Best Dividend Stock You're Ignoring
Fair Value:US$75034.1% undervalued
57 followersusers have followed this narrative
1 commentusers have commented on this narrative
7 likesusers have liked this narrative
TR


tripledub on Intuit ·
A Wonderful Business at a Not-So-Wonderful Price
Fair Value:US$56053.2% undervalued
60 followersusers have followed this narrative
4 commentsusers have commented on this narrative
29 likesusers have liked this narrative
TA


Talos on MindWalk Holdings ·
The Asymmetric TechBio Play: MindWalk Holdings and the Valuation Disconnect
Fair Value:US$8.2781.3% undervalued
33 followersusers have followed this narrative
0 commentsusers have commented on this narrative
8 likesusers have liked this narrative
Recently Updated Narratives
NO

North49_ on iShares - iShares MSCI South Korea ETF ·
EWY:US NYSE Arca iShares Msci South Korea ETF, an opportunity to diversify your tech investments.
Fair Value:US$273.4527.9% undervalued
1 followerusers have followed this narrative
0 commentsusers have commented on this narrative
0 likesusers have liked this narrative
DA


davidlsander on Ubisoft Entertainment ·
Is Ubisoft the Market’s Biggest Pricing Error? Why Forensic Value Points to €33 Per Share
Fair Value:€33.885.3% undervalued
89 followersusers have followed this narrative
7 commentsusers have commented on this narrative
1 likeusers have liked this narrative
RO


RockeTeller on Montage Gold ·
Montage Gold, Building West Africa’s Next 300Koz Producer, First Pour Late 2026, 5.88Moz Resource
Fair Value:CA$23.538.3% undervalued
18 followersusers have followed this narrative
4 commentsusers have commented on this narrative
0 likesusers have liked this narrative
Popular Narratives
MA


martinarauz on Nu Holdings ·
Investment Analysis (May 2026)
Fair Value:US$22.7445.2% undervalued
67 followersusers have followed this narrative
0 commentsusers have commented on this narrative
16 likesusers have liked this narrative
HA


HarishPK on Adobe ·
Adobe: A Probabilistic Case for Undervaluation
Fair Value:US$319.9638.6% undervalued
61 followersusers have followed this narrative
9 commentsusers have commented on this narrative
18 likesusers have liked this narrative
HE


HedgeY on AST SpaceMobile ·
AST SpaceMobile: The Boldest Direct-to-Cell Bet in Public Markets
Fair Value:US$17060.0% undervalued
51 followersusers have followed this narrative
0 commentsusers have commented on this narrative
14 likesusers have liked this narrative
