
Advertisement
There's Reason For Concern Over GWA Group Limited's (ASX:GWA) Price
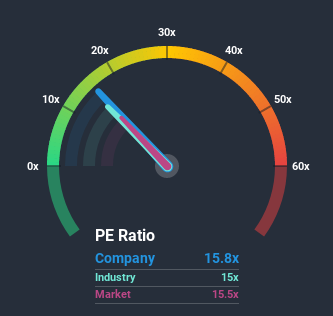
There wouldn't be many who think GWA Group Limited's (ASX:GWA) price-to-earnings (or "P/E") ratio of 15.8x is worth a mention when the median P/E in Australia is similar at about 16x. However, investors might be overlooking a clear opportunity or potential setback if there is no rational basis for the P/E.
While the market has experienced earnings growth lately, GWA Group's earnings have gone into reverse gear, which is not great. One possibility is that the P/E is moderate because investors think this poor earnings performance will turn around. If not, then existing shareholders may be a little nervous about the viability of the share price.
Check out our latest analysis for GWA Group
Does GWA Group Have A Relatively High Or Low P/E For Its Industry?
It's plausible that GWA Group's fairly average P/E ratio could be a result of tendencies within its own industry. You'll notice in the figure below that P/E ratios in the Building industry are also similar to the market. So it appears the company's ratio could be influenced considerably by these industry numbers currently. Some industry P/E's don't move around a lot and right now most companies within the Building industry should be getting restrained. Ultimately though, it's going to be the fundamentals of the business like earnings and growth that count most.
Does Growth Match The P/E?
There's an inherent assumption that a company should be matching the market for P/E ratios like GWA Group's to be considered reasonable.
If we review the last year of earnings, dishearteningly the company's profits fell to the tune of 14%. The last three years don't look nice either as the company has shrunk EPS by 20% in aggregate. Accordingly, shareholders would have felt downbeat about the medium-term rates of earnings growth.
Shifting to the future, estimates from the eight analysts covering the company suggest earnings should grow by 6.0% per year over the next three years. With the market predicted to deliver 11% growth each year, the company is positioned for a weaker earnings result.
In light of this, it's curious that GWA Group's P/E sits in line with the majority of other companies. It seems most investors are ignoring the fairly limited growth expectations and are willing to pay up for exposure to the stock. Maintaining these prices will be difficult to achieve as this level of earnings growth is likely to weigh down the shares eventually.
The Final Word
Generally, our preference is to limit the use of the price-to-earnings ratio to establishing what the market thinks about the overall health of a company.
Our examination of GWA Group's analyst forecasts revealed that its inferior earnings outlook isn't impacting its P/E as much as we would have predicted. Right now we are uncomfortable with the P/E as the predicted future earnings aren't likely to support a more positive sentiment for long. Unless these conditions improve, it's challenging to accept these prices as being reasonable.
Before you settle on your opinion, we've discovered 3 warning signs for GWA Group that you should be aware of.
Of course, you might also be able to find a better stock than GWA Group. So you may wish to see this free collection of other companies that sit on P/E's below 20x and have grown earnings strongly.
When trading GWA Group or any other investment, use the platform considered by many to be the Professional's Gateway to the Worlds Market, Interactive Brokers. You get the lowest-cost* trading on stocks, options, futures, forex, bonds and funds worldwide from a single integrated account.Promoted
New: Manage All Your Stock Portfolios in One Place
We've created the ultimate portfolio companion for stock investors, and it's free.
• Connect an unlimited number of Portfolios and see your total in one currency
• Be alerted to new Warning Signs or Risks via email or mobile
• Track the Fair Value of your stocks
This article by Simply Wall St is general in nature. It does not constitute a recommendation to buy or sell any stock, and does not take account of your objectives, or your financial situation. We aim to bring you long-term focused analysis driven by fundamental data. Note that our analysis may not factor in the latest price-sensitive company announcements or qualitative material. Simply Wall St has no position in any stocks mentioned.
*Interactive Brokers Rated Lowest Cost Broker by StockBrokers.com Annual Online Review 2020
Have feedback on this article? Concerned about the content? Get in touch with us directly. Alternatively, email editorial-team@simplywallst.com.
About ASX:GWA
GWA Group
Research, designs, manufactures, imports, and markets building fixtures and fittings to residential and commercial premises in Australia, New Zealand, the United Kingdom, and internationally.
Very undervalued with solid track record and pays a dividend.
Similar Companies
Market Insights

Advertisement
Community Narratives
MINISO's fair value is projected at 26.69 with an anticipated PE ratio shift of 20x
Fair Value US$24.03|11.0% undervalued
BE
Community Contributor
Procter & Gamble: A Dividend Giant Facing Slowing Growth
Fair Value US$119.81|23.3% overvalued
AN
Community Contributor
Eli Lilly's Future Growth Driven by Tirzepatide and Favorable Market Conditions
Fair Value US$1.19k|13.8% undervalued
EA
Community Contributor