- India
- /
- Auto Components
- /
- NSEI:STERTOOLS
Sterling Tools Limited's (NSE:STERTOOLS) Business Is Yet to Catch Up With Its Share Price

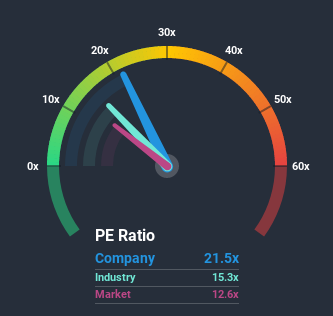
Sterling Tools Limited's (NSE:STERTOOLS) price-to-earnings (or "P/E") ratio of 21.5x might make it look like a strong sell right now compared to the market in India, where around half of the companies have P/E ratios below 12x and even P/E's below 6x are quite common. Although, it's not wise to just take the P/E at face value as there may be an explanation why it's so lofty.
As an illustration, earnings have deteriorated at Sterling Tools over the last year, which is not ideal at all. One possibility is that the P/E is high because investors think the company will still do enough to outperform the broader market in the near future. You'd really hope so, otherwise you're paying a pretty hefty price for no particular reason.
View our latest analysis for Sterling Tools
How Does Sterling Tools' P/E Ratio Compare To Its Industry Peers?
It's plausible that Sterling Tools' particularly high P/E ratio could be a result of tendencies within its own industry. The image below shows that the Auto Components industry as a whole also has a P/E ratio higher than the market. So we'd say there could be some merit in the premise that the company's ratio being shaped by its industry at this time. In the context of the Auto Components industry's current setting, most of its constituents' P/E's would be expected to be raised up. Nonetheless, the greatest force on the company's P/E will be its own earnings growth expectations.

Is There Enough Growth For Sterling Tools?
The only time you'd be truly comfortable seeing a P/E as steep as Sterling Tools' is when the company's growth is on track to outshine the market decidedly.
If we review the last year of earnings, dishearteningly the company's profits fell to the tune of 32%. This means it has also seen a slide in earnings over the longer-term as EPS is down 26% in total over the last three years. Accordingly, shareholders would have felt downbeat about the medium-term rates of earnings growth.
This is in contrast to the rest of the market, which is expected to decline by 7.3% over the next year, or less than the company's recent medium-term annualised earnings decline.
In light of this, it's odd that Sterling Tools' P/E sits above the majority of other companies. With earnings going quickly in reverse, it's not guaranteed that the P/E has found a floor yet. There's potential for the P/E to fall to lower levels if the company doesn't improve its profitability, which would be difficult to do with the current market outlook.
The Bottom Line On Sterling Tools' P/E
While the price-to-earnings ratio shouldn't be the defining factor in whether you buy a stock or not, it's quite a capable barometer of earnings expectations.
We've established that Sterling Tools currently trades on a much higher than expected P/E since its recent three-year earnings are even worse than the forecasts for a struggling market. When we see below average earnings, we suspect the share price is at risk of declining, sending the high P/E lower. In addition, we would be concerned whether the company can even maintain its medium-term level of performance under these tough market conditions. This would place shareholders' investments at significant risk and potential investors in danger of paying an excessive premium.
Don't forget that there may be other risks. For instance, we've identified 3 warning signs for Sterling Tools that you should be aware of.
It's important to make sure you look for a great company, not just the first idea you come across. So take a peek at this free list of interesting companies with strong recent earnings growth (and a P/E ratio below 20x).
When trading Sterling Tools or any other investment, use the platform considered by many to be the Professional's Gateway to the Worlds Market, Interactive Brokers. You get the lowest-cost* trading on stocks, options, futures, forex, bonds and funds worldwide from a single integrated account.Promoted
If you're looking to trade Sterling Tools, open an account with the lowest-cost platform trusted by professionals, Interactive Brokers.
With clients in over 200 countries and territories, and access to 160 markets, IBKR lets you trade stocks, options, futures, forex, bonds and funds from a single integrated account.
Enjoy no hidden fees, no account minimums, and FX conversion rates as low as 0.03%, far better than what most brokers offer.
Sponsored ContentNew: Manage All Your Stock Portfolios in One Place
We've created the ultimate portfolio companion for stock investors, and it's free.
• Connect an unlimited number of Portfolios and see your total in one currency
• Be alerted to new Warning Signs or Risks via email or mobile
• Track the Fair Value of your stocks
This article by Simply Wall St is general in nature. It does not constitute a recommendation to buy or sell any stock, and does not take account of your objectives, or your financial situation. We aim to bring you long-term focused analysis driven by fundamental data. Note that our analysis may not factor in the latest price-sensitive company announcements or qualitative material. Simply Wall St has no position in any stocks mentioned.
*Interactive Brokers Rated Lowest Cost Broker by StockBrokers.com Annual Online Review 2020
Have feedback on this article? Concerned about the content? Get in touch with us directly. Alternatively, email editorial-team@simplywallst.com.
About NSEI:STERTOOLS
Sterling Tools
Manufactures and sells high tensile cold forged fasteners to original equipment manufacturers in India.
Flawless balance sheet with solid track record and pays a dividend.


