Advertisement
- Canada
- /
- Professional Services
- /
- TSX:IBG
Should You Rely On IBI Group's (TSE:IBG) Earnings Growth?
Statistically speaking, it is less risky to invest in profitable companies than in unprofitable ones. Having said that, sometimes statutory profit levels are not a good guide to ongoing profitability, because some short term one-off factor has impacted profit levels. This article will consider whether IBI Group's (TSE:IBG) statutory profits are a good guide to its underlying earnings.
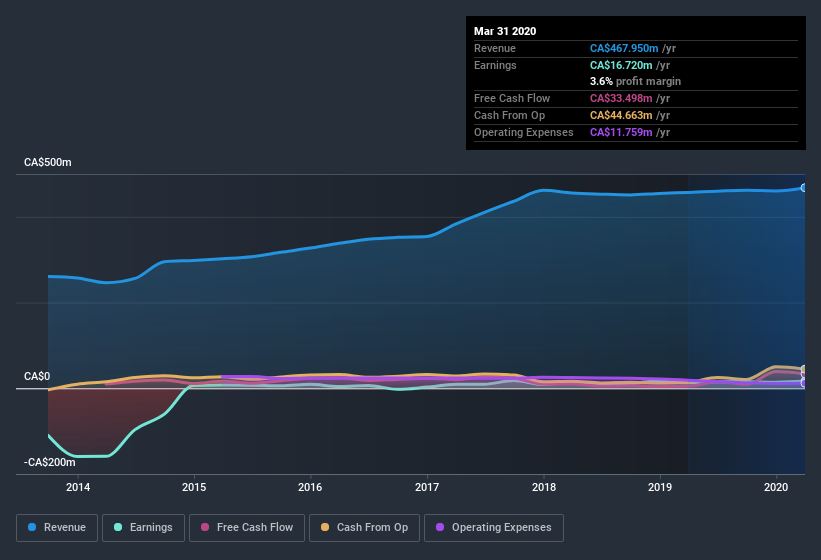
While IBI Group was able to generate revenue of CA$468.0m in the last twelve months, we think its profit result of CA$16.7m was more important. In the chart below, you can see that its profit and revenue have both grown over the last three years.
View our latest analysis for IBI Group
Not all profits are equal, and we can learn more about the nature of a company's past profitability by diving deeper into the financial statements. So today we'll look at what IBI Group's cashflow tells us about the quality of its earnings. That might leave you wondering what analysts are forecasting in terms of future profitability. Luckily, you can click here to see an interactive graph depicting future profitability, based on their estimates.
Zooming In On IBI Group's Earnings
Many investors haven't heard of the accrual ratio from cashflow, but it is actually a useful measure of how well a company's profit is backed up by free cash flow (FCF) during a given period. The accrual ratio subtracts the FCF from the profit for a given period, and divides the result by the average operating assets of the company over that time. This ratio tells us how much of a company's profit is not backed by free cashflow.
As a result, a negative accrual ratio is a positive for the company, and a positive accrual ratio is a negative. That is not intended to imply we should worry about a positive accrual ratio, but it's worth noting where the accrual ratio is rather high. That's because some academic studies have suggested that high accruals ratios tend to lead to lower profit or less profit growth.
For the year to March 2020, IBI Group had an accrual ratio of -0.11. That implies it has good cash conversion, and implies that its free cash flow solidly exceeded its profit last year. To wit, it produced free cash flow of CA$33m during the period, dwarfing its reported profit of CA$16.7m. IBI Group's free cash flow improved over the last year, which is generally good to see.
Our Take On IBI Group's Profit Performance
IBI Group's accrual ratio is solid, and indicates strong free cash flow, as we discussed, above. Based on this observation, we consider it likely that IBI Group's statutory profit actually understates its earnings potential! And on top of that, its earnings per share have grown at 61% per year over the last three years. At the end of the day, it's essential to consider more than just the factors above, if you want to understand the company properly. If you'd like to know more about IBI Group as a business, it's important to be aware of any risks it's facing. Case in point: We've spotted 2 warning signs for IBI Group you should be aware of.
Today we've zoomed in on a single data point to better understand the nature of IBI Group's profit. But there is always more to discover if you are capable of focussing your mind on minutiae. Some people consider a high return on equity to be a good sign of a quality business. So you may wish to see this free collection of companies boasting high return on equity, or this list of stocks that insiders are buying.
When trading IBI Group or any other investment, use the platform considered by many to be the Professional's Gateway to the Worlds Market, Interactive Brokers. You get the lowest-cost* trading on stocks, options, futures, forex, bonds and funds worldwide from a single integrated account. Promoted
New: AI Stock Screener & Alerts
Our new AI Stock Screener scans the market every day to uncover opportunities.
• Dividend Powerhouses (3%+ Yield)
• Undervalued Small Caps with Insider Buying
• High growth Tech and AI Companies
Or build your own from over 50 metrics.
This article by Simply Wall St is general in nature. It does not constitute a recommendation to buy or sell any stock, and does not take account of your objectives, or your financial situation. We aim to bring you long-term focused analysis driven by fundamental data. Note that our analysis may not factor in the latest price-sensitive company announcements or qualitative material. Simply Wall St has no position in any stocks mentioned.
*Interactive Brokers Rated Lowest Cost Broker by StockBrokers.com Annual Online Review 2020
Have feedback on this article? Concerned about the content? Get in touch with us directly. Alternatively, email editorial-team@simplywallst.com.
About TSX:IBG
IBI Group
IBI Group Inc. provides various professional services in Canada, the United States, the United Kingdom, and internationally.
Outstanding track record with excellent balance sheet.
Market Insights


Advertisement
Weekly Picks
ST


stuart_roberts on Upside Gold ·
An Undervalued 3.3Moz Gold Project in Canada
Fair Value:CA$5.0775.1% undervalued
109 followersusers have followed this narrative
1 commentusers have commented on this narrative
19 likesusers have liked this narrative
YA

Yang_ on SoFi Technologies ·
SoFi Technologies: The Apex Aggregator and the Infrastructure of the Modern Financial System
Fair Value:US$22.9819.4% undervalued
32 followersusers have followed this narrative
0 commentsusers have commented on this narrative
28 likesusers have liked this narrative
KO

Kouj on CSL ·
CSL: The Dip Is the Opportunity
Fair Value:AU$1558.0% undervalued
13 followersusers have followed this narrative
0 commentsusers have commented on this narrative
11 likesusers have liked this narrative
GA

GavrielH on DHT Holdings ·
DHT Holdings, inc: Strait of Hormuz Risk Amidst US-Israel vs Iran Tensions Spikes VLCC Rates.
Fair Value:US$3650.4% undervalued
12 followersusers have followed this narrative
0 commentsusers have commented on this narrative
6 likesusers have liked this narrative
Recently Updated Narratives
AR


AryaWinningSon on Axon Enterprise ·
From Tasers to SaaS: Axon’s Quiet Platform Transformation
Fair Value:US$606.8314.7% undervalued
1 followerusers have followed this narrative
0 commentsusers have commented on this narrative
0 likesusers have liked this narrative
MD

Mdeegan on Oracle ·
Oracle: The AI Infrastructure Story Hiding in Plain Sight
Fair Value:US$119.9736.0% overvalued
1 followerusers have followed this narrative
0 commentsusers have commented on this narrative
0 likesusers have liked this narrative
MA


MarkoVT on ANYCOLOR ·
Near zero debt, Japan centric focus provides future growth
Fair Value:JP¥8.25k50.8% undervalued
3 followersusers have followed this narrative
0 commentsusers have commented on this narrative
1 likeusers have liked this narrative
Popular Narratives
KA

kabz2342 on Nu Holdings ·
Nu holdings will continue to disrupt the South American banking market
Fair Value:US$64.377.5% undervalued
52 followersusers have followed this narrative
3 commentsusers have commented on this narrative
27 likesusers have liked this narrative
AN


AnalystConsensusTarget on Microsoft ·
Analyst Commentary Highlights Microsoft AI Momentum and Upward Valuation Amid Growth and Competitive Risks
Fair Value:US$59632.1% undervalued
1306 followersusers have followed this narrative
2 commentsusers have commented on this narrative
10 likesusers have liked this narrative
AN

AnalystConsensusTarget on NVIDIA ·
NVDA: Expanding AI Demand Will Drive Major Data Center Investments Through 2026
Fair Value:US$253.0226.5% undervalued
1102 followersusers have followed this narrative
7 commentsusers have commented on this narrative
34 likesusers have liked this narrative

