Advertisement
Should You Or Shouldn't You: A Dividend Analysis on Dunkin' Brands Group, Inc. (NASDAQ:DNKN)
Is Dunkin' Brands Group, Inc. (NASDAQ:DNKN) a good dividend stock? How can we tell? Dividend paying companies with growing earnings can be highly rewarding in the long term. If you are hoping to live on your dividends, it's important to be more stringent with your investments than the average punter. Regular readers know we like to apply the same approach to each dividend stock, and we hope you'll find our analysis useful.
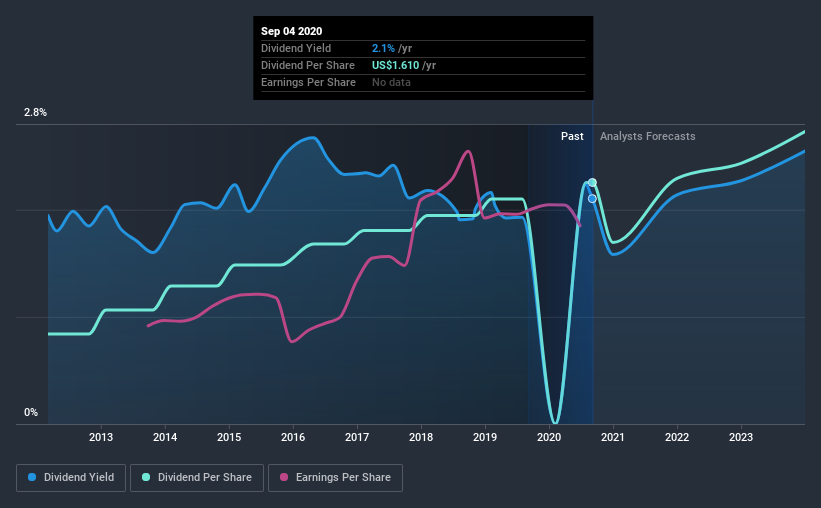
With a 2.1% yield and a eight-year payment history, investors probably think Dunkin' Brands Group looks like a reliable dividend stock. A low yield is generally a turn-off, but if the prospects for earnings growth were strong, investors might be pleasantly surprised by the long-term results. The company also bought back stock equivalent to around 0.9% of market capitalisation this year. Before you buy any stock for its dividend however, you should always remember Warren Buffett's two rules: 1) Don't lose money, and 2) Remember rule #1. We'll run through some checks below to help with this.
Click the interactive chart for our full dividend analysis
Payout ratios
Companies (usually) pay dividends out of their earnings. If a company is paying more than it earns, the dividend might have to be cut. Comparing dividend payments to a company's net profit after tax is a simple way of reality-checking whether a dividend is sustainable. Looking at the data, we can see that 44% of Dunkin' Brands Group's profits were paid out as dividends in the last 12 months. A medium payout ratio strikes a good balance between paying dividends, and keeping enough back to invest in the business. One of the risks is that management reinvests the retained capital poorly instead of paying a higher dividend.
We also measure dividends paid against a company's levered free cash flow, to see if enough cash was generated to cover the dividend. Dunkin' Brands Group's cash payout ratio in the last year was 42%, which suggests dividends were well covered by cash generated by the business. It's encouraging to see that the dividend is covered by both profit and cash flow. This generally suggests the dividend is sustainable, as long as earnings don't drop precipitously.
Is Dunkin' Brands Group's Balance Sheet Risky?
As Dunkin' Brands Group has a meaningful amount of debt, we need to check its balance sheet to see if the company might have debt risks. A quick check of its financial situation can be done with two ratios: net debt divided by EBITDA (earnings before interest, tax, depreciation and amortisation), and net interest cover. Net debt to EBITDA measures total debt load relative to company earnings (lower = less debt), while net interest cover measures the ability to pay interest on the debt (higher = greater ability to pay interest costs). Dunkin' Brands Group has net debt of 5.75 times its EBITDA, which implies meaningful risk if interest rates rise of earnings decline.
Net interest cover can be calculated by dividing earnings before interest and tax (EBIT) by the company's net interest expense. Interest cover of 3.25 times its interest expense is starting to become a concern for Dunkin' Brands Group, and be aware that lenders may place additional restrictions on the company as well. Low interest cover and high debt can create problems right when the investor least needs them, and we're reluctant to rely on the dividend of companies with these traits.
We update our data on Dunkin' Brands Group every 24 hours, so you can always get our latest analysis of its financial health, here.
Dividend Volatility
Before buying a stock for its income, we want to see if the dividends have been stable in the past, and if the company has a track record of maintaining its dividend. The first recorded dividend for Dunkin' Brands Group, in the last decade, was eight years ago. Although it has been paying a dividend for several years now, the dividend has been cut at least once, and we're cautious about the consistency of its dividend across a full economic cycle. During the past eight-year period, the first annual payment was US$0.6 in 2012, compared to US$1.6 last year. This works out to be a compound annual growth rate (CAGR) of approximately 13% a year over that time. The dividends haven't grown at precisely 13% every year, but this is a useful way to average out the historical rate of growth.
It's not great to see that the payment has been cut in the past. We're generally more wary of companies that have cut their dividend before, as they tend to perform worse in an economic downturn.
Dividend Growth Potential
Given that the dividend has been cut in the past, we need to check if earnings are growing and if that might lead to stronger dividends in the future. Earnings have grown at around 9.6% a year for the past five years, which is better than seeing them shrink! It's good to see decent earnings growth and a low payout ratio. Companies with these characteristics often display the fastest dividend growth over the long term - assuming earnings can be maintained, of course.
Conclusion
To summarise, shareholders should always check that Dunkin' Brands Group's dividends are affordable, that its dividend payments are relatively stable, and that it has decent prospects for growing its earnings and dividend. First, we like that the company's dividend payments appear well covered, although the retained capital also needs to be effectively reinvested. Next, earnings growth has been good, but unfortunately the dividend has been cut at least once in the past. Dunkin' Brands Group performs highly under this analysis, although it falls slightly short of our exacting standards. At the right valuation, it could be a solid dividend prospect.
Market movements attest to how highly valued a consistent dividend policy is compared to one which is more unpredictable. Still, investors need to consider a host of other factors, apart from dividend payments, when analysing a company. Just as an example, we've come accross 3 warning signs for Dunkin' Brands Group you should be aware of, and 1 of them doesn't sit too well with us.
If you are a dividend investor, you might also want to look at our curated list of dividend stocks yielding above 3%.
If you decide to trade Dunkin' Brands Group, use the lowest-cost* platform that is rated #1 Overall by Barron’s, Interactive Brokers. Trade stocks, options, futures, forex, bonds and funds on 135 markets, all from a single integrated account. Promoted
New: Manage All Your Stock Portfolios in One Place
We've created the ultimate portfolio companion for stock investors, and it's free.
• Connect an unlimited number of Portfolios and see your total in one currency
• Be alerted to new Warning Signs or Risks via email or mobile
• Track the Fair Value of your stocks
This article by Simply Wall St is general in nature. It does not constitute a recommendation to buy or sell any stock, and does not take account of your objectives, or your financial situation. We aim to bring you long-term focused analysis driven by fundamental data. Note that our analysis may not factor in the latest price-sensitive company announcements or qualitative material. Simply Wall St has no position in any stocks mentioned.
*Interactive Brokers Rated Lowest Cost Broker by StockBrokers.com Annual Online Review 2020
Have feedback on this article? Concerned about the content? Get in touch with us directly. Alternatively, email editorial-team@simplywallst.com.
Market Insights


Advertisement
Weekly Picks
LO


Lou_Basenese on Virtuix Holdings ·
From a “Shark Tank” Snub to an Air Force “Yes”: Why Virtuix at $3.50 May Be the Market’s Most Mispriced AI Story
Fair Value:US$7.563.6% undervalued
30 followersusers have followed this narrative
0 commentsusers have commented on this narrative
5 likesusers have liked this narrative
IN


Investingwilly on Mastercard ·
Mastercard: The Best Dividend Stock You're Ignoring
Fair Value:US$75032.0% undervalued
76 followersusers have followed this narrative
1 commentusers have commented on this narrative
9 likesusers have liked this narrative
TR


tripledub on Intuit ·
A Wonderful Business at a Not-So-Wonderful Price
Fair Value:US$56052.4% undervalued
66 followersusers have followed this narrative
4 commentsusers have commented on this narrative
31 likesusers have liked this narrative
TA


Talos on MindWalk Holdings ·
The Asymmetric TechBio Play: MindWalk Holdings and the Valuation Disconnect
Fair Value:US$8.2779.9% undervalued
36 followersusers have followed this narrative
0 commentsusers have commented on this narrative
9 likesusers have liked this narrative
Recently Updated Narratives
RO


RockeTeller on Abitibi Metals ·
Abitibi Metals’ High-Grade B26 Polymetallic Deposit Trading at a Fraction of Peers, 96% Undervalued?
Fair Value:CA$1.2950.4% undervalued
4 followersusers have followed this narrative
0 commentsusers have commented on this narrative
1 likeusers have liked this narrative
EV

everyseed on Zylox-Tonbridge Medical Technology ·
Zylox-Tonbridge: Early Signs of an Emerging Global Vascular Intervention Platform
Fair Value:HK$30.8539.9% undervalued
1 followerusers have followed this narrative
0 commentsusers have commented on this narrative
0 likesusers have liked this narrative
AN

Anthony_Lee on Geohan Corporation Berhad ·
Geohan's Growth Outlook Brightens on Expanding Order Book and Easing Cost Pressures
Fair Value:RM 0.7460.8% undervalued
2 followersusers have followed this narrative
0 commentsusers have commented on this narrative
0 likesusers have liked this narrative
Popular Narratives
IN
Investingwilly on Mastercard ·
Mastercard: The Best Dividend Stock You're Ignoring
Fair Value:US$75032.0% undervalued
76 followersusers have followed this narrative
1 commentusers have commented on this narrative
9 likesusers have liked this narrative
HA


HarishPK on Adobe ·
Adobe: A Probabilistic Case for Undervaluation
Fair Value:US$319.9635.5% undervalued
62 followersusers have followed this narrative
9 commentsusers have commented on this narrative
19 likesusers have liked this narrative
MA


martinarauz on Nu Holdings ·
Investment Analysis (May 2026)
Fair Value:US$22.7442.3% undervalued
68 followersusers have followed this narrative
0 commentsusers have commented on this narrative
17 likesusers have liked this narrative
