- India
- /
- Professional Services
- /
- NSEI:TEAMLEASE
Should You Be Impressed By TeamLease Services' (NSE:TEAMLEASE) Returns on Capital?


There are a few key trends to look for if we want to identify the next multi-bagger. Amongst other things, we'll want to see two things; firstly, a growing return on capital employed (ROCE) and secondly, an expansion in the company's amount of capital employed. Ultimately, this demonstrates that it's a business that is reinvesting profits at increasing rates of return. Having said that, from a first glance at TeamLease Services (NSE:TEAMLEASE) we aren't jumping out of our chairs at how returns are trending, but let's have a deeper look.
What is Return On Capital Employed (ROCE)?
For those that aren't sure what ROCE is, it measures the amount of pre-tax profits a company can generate from the capital employed in its business. To calculate this metric for TeamLease Services, this is the formula:
Return on Capital Employed = Earnings Before Interest and Tax (EBIT) ÷ (Total Assets - Current Liabilities)
0.097 = ₹664m ÷ (₹13b - ₹5.7b) (Based on the trailing twelve months to June 2020).
So, TeamLease Services has an ROCE of 9.7%. On its own, that's a low figure but it's around the 8.2% average generated by the Professional Services industry.
Check out our latest analysis for TeamLease Services
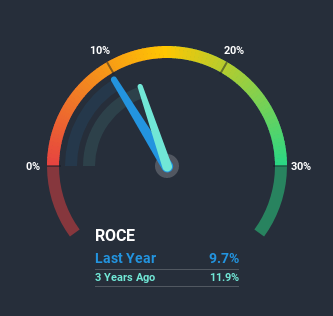
Above you can see how the current ROCE for TeamLease Services compares to its prior returns on capital, but there's only so much you can tell from the past. If you're interested, you can view the analysts predictions in our free report on analyst forecasts for the company.
How Are Returns Trending?
On the surface, the trend of ROCE at TeamLease Services doesn't inspire confidence. To be more specific, ROCE has fallen from 14% over the last five years. Meanwhile, the business is utilizing more capital but this hasn't moved the needle much in terms of sales in the past 12 months, so this could reflect longer term investments. It's worth keeping an eye on the company's earnings from here on to see if these investments do end up contributing to the bottom line.
On a separate but related note, it's important to know that TeamLease Services has a current liabilities to total assets ratio of 46%, which we'd consider pretty high. This effectively means that suppliers (or short-term creditors) are funding a large portion of the business, so just be aware that this can introduce some elements of risk. While it's not necessarily a bad thing, it can be beneficial if this ratio is lower.In Conclusion...
Bringing it all together, while we're somewhat encouraged by TeamLease Services' reinvestment in its own business, we're aware that returns are shrinking. Since the stock has gained an impressive 46% over the last three years, investors must think there's better things to come. However, unless these underlying trends turn more positive, we wouldn't get our hopes up too high.
One more thing to note, we've identified 4 warning signs with TeamLease Services and understanding them should be part of your investment process.
For those who like to invest in solid companies, check out this free list of companies with solid balance sheets and high returns on equity.
When trading TeamLease Services or any other investment, use the platform considered by many to be the Professional's Gateway to the Worlds Market, Interactive Brokers. You get the lowest-cost* trading on stocks, options, futures, forex, bonds and funds worldwide from a single integrated account. Promoted
Valuation is complex, but we're here to simplify it.
Discover if TeamLease Services might be undervalued or overvalued with our detailed analysis, featuring fair value estimates, potential risks, dividends, insider trades, and its financial condition.
Access Free AnalysisThis article by Simply Wall St is general in nature. It does not constitute a recommendation to buy or sell any stock, and does not take account of your objectives, or your financial situation. We aim to bring you long-term focused analysis driven by fundamental data. Note that our analysis may not factor in the latest price-sensitive company announcements or qualitative material. Simply Wall St has no position in any stocks mentioned.
*Interactive Brokers Rated Lowest Cost Broker by StockBrokers.com Annual Online Review 2020
Have feedback on this article? Concerned about the content? Get in touch with us directly. Alternatively, email editorial-team@simplywallst.com.
About NSEI:TEAMLEASE
TeamLease Services
Engages in human resource services to various industries in India and internationally.
Flawless balance sheet with reasonable growth potential.
