
Advertisement
- Australia
- /
- Personal Products
- /
- ASX:BKL
Should We Worry About Blackmores Limited's (ASX:BKL) P/E Ratio?
This article is for investors who would like to improve their understanding of price to earnings ratios (P/E ratios). We'll apply a basic P/E ratio analysis to Blackmores Limited's (ASX:BKL), to help you decide if the stock is worth further research. Based on the last twelve months, Blackmores's P/E ratio is 36.98. That means that at current prices, buyers pay A$36.98 for every A$1 in trailing yearly profits.
Check out our latest analysis for Blackmores
How Do I Calculate A Price To Earnings Ratio?
The formula for price to earnings is:
Price to Earnings Ratio = Share Price ÷ Earnings per Share (EPS)
Or for Blackmores:
P/E of 36.98 = A$79.630 ÷ A$2.153 (Based on the trailing twelve months to December 2019.)
(Note: the above calculation results may not be precise due to rounding.)
Is A High Price-to-Earnings Ratio Good?
A higher P/E ratio implies that investors pay a higher price for the earning power of the business. That isn't a good or a bad thing on its own, but a high P/E means that buyers have a higher opinion of the business's prospects, relative to stocks with a lower P/E.
How Does Blackmores's P/E Ratio Compare To Its Peers?
We can get an indication of market expectations by looking at the P/E ratio. The image below shows that Blackmores has a higher P/E than the average (22.5) P/E for companies in the personal products industry.
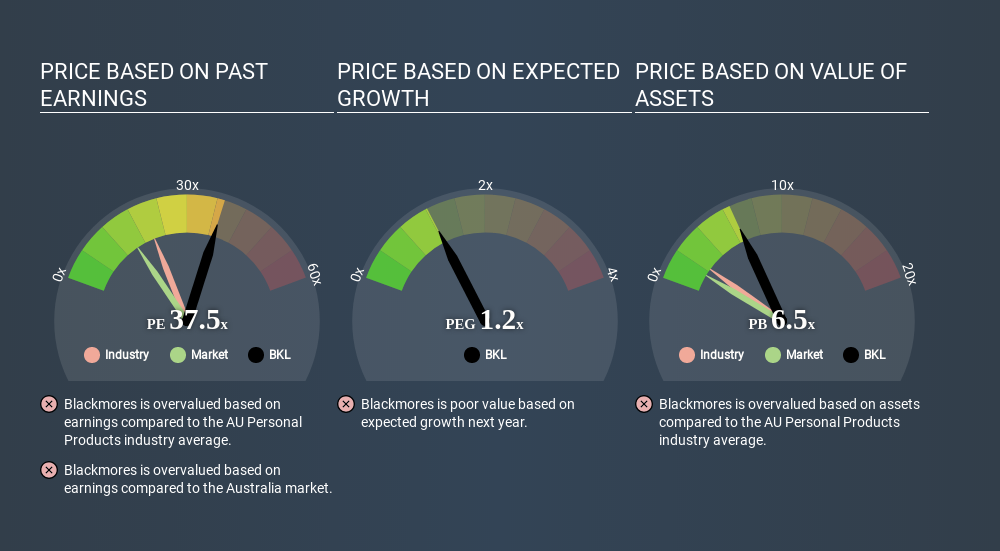
That means that the market expects Blackmores will outperform other companies in its industry. Shareholders are clearly optimistic, but the future is always uncertain. So investors should delve deeper. I like to check if company insiders have been buying or selling.
How Growth Rates Impact P/E Ratios
Companies that shrink earnings per share quickly will rapidly decrease the 'E' in the equation. That means unless the share price falls, the P/E will increase in a few years. A higher P/E should indicate the stock is expensive relative to others -- and that may encourage shareholders to sell.
Blackmores's earnings per share fell by 47% in the last twelve months. But EPS is up 2.9% over the last 5 years. And it has shrunk its earnings per share by 23% per year over the last three years. This growth rate might warrant a low P/E ratio.
Remember: P/E Ratios Don't Consider The Balance Sheet
One drawback of using a P/E ratio is that it considers market capitalization, but not the balance sheet. So it won't reflect the advantage of cash, or disadvantage of debt. The exact same company would hypothetically deserve a higher P/E ratio if it had a strong balance sheet, than if it had a weak one with lots of debt, because a cashed up company can spend on growth.
Such expenditure might be good or bad, in the long term, but the point here is that the balance sheet is not reflected by this ratio.
Blackmores's Balance Sheet
Blackmores's net debt is 8.1% of its market cap. It would probably trade on a higher P/E ratio if it had a lot of cash, but I doubt it is having a big impact.
The Bottom Line On Blackmores's P/E Ratio
Blackmores trades on a P/E ratio of 37.0, which is above its market average of 15.9. With some debt but no EPS growth last year, the market has high expectations of future profits.
When the market is wrong about a stock, it gives savvy investors an opportunity. People often underestimate remarkable growth -- so investors can make money when fast growth is not fully appreciated. So this free report on the analyst consensus forecasts could help you make a master move on this stock.
But note: Blackmores may not be the best stock to buy. So take a peek at this free list of interesting companies with strong recent earnings growth (and a P/E ratio below 20).
Love or hate this article? Concerned about the content? Get in touch with us directly. Alternatively, email editorial-team@simplywallst.com.
This article by Simply Wall St is general in nature. It does not constitute a recommendation to buy or sell any stock, and does not take account of your objectives, or your financial situation. We aim to bring you long-term focused analysis driven by fundamental data. Note that our analysis may not factor in the latest price-sensitive company announcements or qualitative material. Simply Wall St has no position in any stocks mentioned. Thank you for reading.
 mitchell_lawler
The Foxhole
Micron (MU) is booming, and it still doesn't look ‘expensive’ based on next year's earnings. So why does our own valuation say it could be worth 40% less?
78
zoe_vi5fn
A low price to earnings ratio at the top of the cycle is a warning rather than a bargain, and a terrifyingly high one at the bottom is often the entry point
darius_xnnrd
Memory used to have a dozen participants racing each other into oversupply, and now it has three. High bandwidth memory is qualified into customer designs years ahead, sold under long-term agreements, and is far harder to switch away from than commodity DRAM.
About ASX:BKL
Blackmores
Blackmores Limited develops, sells, and markets natural health products for humans and animals in Australia, New Zealand, Asia, China, and India.
Flawless balance sheet with reasonable growth potential.
Similar Companies
Market Insights

Advertisement
Weekly Picks
RI


Rick_Orford on Starfighters Space ·
The 1960s Fighter Jet That Could Crack Open a $20 Billion Satellite Market
Fair Value:US$519.8% undervalued
22 followersusers have followed this narrative
1 commentusers have commented on this narrative
3 likesusers have liked this narrative
FU


FundamentalFlow on Vertiv Holdings Co ·
The Short and Long Term Compounder of Liquid Cooling industry.
Fair Value:US$45036.2% undervalued
49 followersusers have followed this narrative
0 commentsusers have commented on this narrative
13 likesusers have liked this narrative
JO


John_Eric on SPX Technologies ·
I Fell in Love With a Data-Center Cooling Stock. Then I Opened the Filings.
Fair Value:US$2034.5% overvalued
20 followersusers have followed this narrative
2 commentsusers have commented on this narrative
4 likesusers have liked this narrative
TR


tripledub on GQG Partners ·
The Cheap Genius Problem
Fair Value:AU$3.2155.0% undervalued
30 followersusers have followed this narrative
0 commentsusers have commented on this narrative
21 likesusers have liked this narrative
Recently Updated Narratives
DP


DP_invest on BWG ·
High rates continues for Q4 '26 - Q1 '27
Fair Value:NOK 2359.4% undervalued
1 followerusers have followed this narrative
0 commentsusers have commented on this narrative
0 likesusers have liked this narrative
AG


Agricola on Salazar Resources ·
A Case for Salazar Resources to reach CAD $2.50 - $7.50+ by 2030
Fair Value:CA$7.594.7% undervalued
1 followerusers have followed this narrative
0 commentsusers have commented on this narrative
0 likesusers have liked this narrative
ST


StoxEurope on Sipef ·
Why I Invest in SIPEF?
Fair Value:€116.2914.9% undervalued
16 followersusers have followed this narrative
4 commentsusers have commented on this narrative
0 likesusers have liked this narrative
Popular Narratives
OS


oscargarcia on NVIDIA ·
The company that went from selling GPUs to gamers to becoming the AI arms dealer of the 21st century.
Fair Value:US$28019.5% undervalued
307 followersusers have followed this narrative
9 commentsusers have commented on this narrative
16 likesusers have liked this narrative
CU

CubanEros on Microsoft ·
A wonderful business at reasonable price.
Fair Value:US$419.9118.3% overvalued
164 followersusers have followed this narrative
0 commentsusers have commented on this narrative
8 likesusers have liked this narrative
KI

KiwiInvest on Amazon.com ·
Amazon's high growth, high tech segments propel its profits, while traditional segments plod along
Fair Value:US$475.0944.2% undervalued
186 followersusers have followed this narrative
1 commentusers have commented on this narrative
8 likesusers have liked this narrative
Trending Discussion
GE

george_b177x on Bloom Energy ·
Brilliant analysis. Great company with proven product and service!
1
|1
IA

ian_oii7z on Woodside Energy Group ·
Hey James! Thank you but I am not sure if I am reading this correctly as your analysis opens with "At A$36.602 per share, Woodside Energy Group (ASX: WDS) appears reasonably valued based on its existing operations and near-term production growth." I would like to say that the last time that WDS was above $36.00 per share was in October 2023, so I am a little confused by your statement w.r.t. current prices etc . Can you please explain?
1
|0