
Advertisement
- Singapore
- /
- Infrastructure
- /
- SGX:S58
SATS Ltd. (SGX:S58) Is Employing Capital Very Effectively
Today we'll evaluate SATS Ltd. (SGX:S58) to determine whether it could have potential as an investment idea. Specifically, we're going to calculate its Return On Capital Employed (ROCE), in the hopes of getting some insight into the business.
First of all, we'll work out how to calculate ROCE. Then we'll compare its ROCE to similar companies. Then we'll determine how its current liabilities are affecting its ROCE.
Return On Capital Employed (ROCE): What is it?
ROCE is a measure of a company's yearly pre-tax profit (its return), relative to the capital employed in the business. Generally speaking a higher ROCE is better. In brief, it is a useful tool, but it is not without drawbacks. Author Edwin Whiting says to be careful when comparing the ROCE of different businesses, since 'No two businesses are exactly alike.
How Do You Calculate Return On Capital Employed?
Analysts use this formula to calculate return on capital employed:
Return on Capital Employed = Earnings Before Interest and Tax (EBIT) ÷ (Total Assets - Current Liabilities)
Or for SATS:
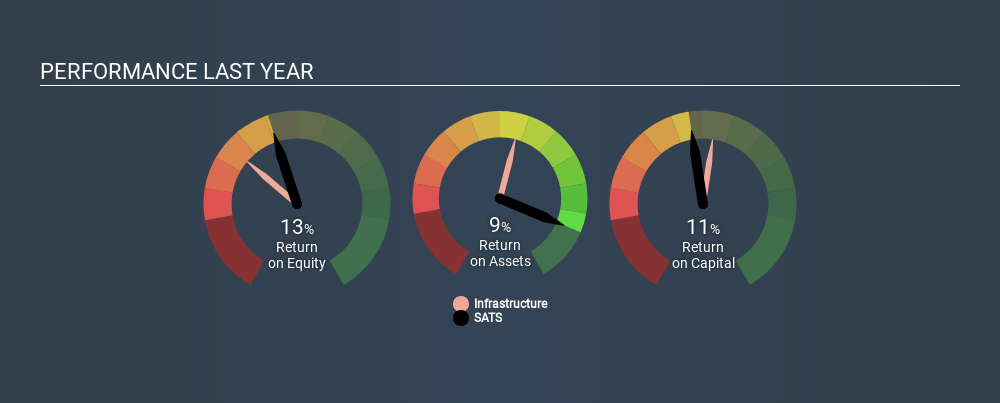
0.11 = S$240m ÷ (S$2.6b - S$448m) (Based on the trailing twelve months to December 2019.)
So, SATS has an ROCE of 11%.
See our latest analysis for SATS
Is SATS's ROCE Good?
ROCE can be useful when making comparisons, such as between similar companies. SATS's ROCE appears to be substantially greater than the 6.7% average in the Infrastructure industry. We consider this a positive sign, because it suggests it uses capital more efficiently than similar companies. Regardless of where SATS sits next to its industry, its ROCE in absolute terms appears satisfactory, and this company could be worth a closer look.
You can click on the image below to see (in greater detail) how SATS's past growth compares to other companies.
When considering this metric, keep in mind that it is backwards looking, and not necessarily predictive. Companies in cyclical industries can be difficult to understand using ROCE, as returns typically look high during boom times, and low during busts. This is because ROCE only looks at one year, instead of considering returns across a whole cycle. Since the future is so important for investors, you should check out our free report on analyst forecasts for SATS.
Do SATS's Current Liabilities Skew Its ROCE?
Liabilities, such as supplier bills and bank overdrafts, are referred to as current liabilities if they need to be paid within 12 months. Due to the way the ROCE equation works, having large bills due in the near term can make it look as though a company has less capital employed, and thus a higher ROCE than usual. To check the impact of this, we calculate if a company has high current liabilities relative to its total assets.
SATS has current liabilities of S$448m and total assets of S$2.6b. Therefore its current liabilities are equivalent to approximately 17% of its total assets. Current liabilities are minimal, limiting the impact on ROCE.
Our Take On SATS's ROCE
With that in mind, SATS's ROCE appears pretty good. There might be better investments than SATS out there, but you will have to work hard to find them . These promising businesses with rapidly growing earnings might be right up your alley.
For those who like to find winning investments this free list of growing companies with recent insider purchasing, could be just the ticket.
If you spot an error that warrants correction, please contact the editor at editorial-team@simplywallst.com. This article by Simply Wall St is general in nature. It does not constitute a recommendation to buy or sell any stock, and does not take account of your objectives, or your financial situation. Simply Wall St has no position in the stocks mentioned.
We aim to bring you long-term focused research analysis driven by fundamental data. Note that our analysis may not factor in the latest price-sensitive company announcements or qualitative material. Thank you for reading.
MI

The Foxhole
Is Nvidia actually expensive at 32 times earnings? I think that number can melt faster than people realise.
1510
MA
marcus_l38oa
Why would I fret over Nvidia results now? I think it's moment has gone. I will invert and see what companies can be the next Nvidia.
SE
sean_3pk06
Multiple has already melted 50 percent in the last year. It can melt another 50 percent from here in the next year?
 Mitchell Lawler
Market Insights
Which payment stocks actually get paid?

Every new payment app was supposed to kill Visa and Mastercard. Instead, they got bigger. So what does that mean for the payment stocks on your radar?
42
About SGX:S58
SATS
An investment holding company, provides gateway services and food solutions in Singapore, the Asia Pacific, the Americas, Europe, the Middle East, Africa, and internationally.
Proven track record and fair value.
Market Insights


Advertisement
Weekly Picks
RI


Rick_Orford on Starfighters Space ·
The 1960s Fighter Jet That Could Crack Open a $20 Billion Satellite Market
Fair Value:US$522.6% undervalued
71 followersusers have followed this narrative
4 commentsusers have commented on this narrative
11 likesusers have liked this narrative
TR


tripledub on Meta Platforms ·
The $135 Billion Bet That Should Make Every Shareholder Nervous
Fair Value:US$5861.7% undervalued
56 followersusers have followed this narrative
3 commentsusers have commented on this narrative
34 likesusers have liked this narrative
TA


Talos on Voyager Technologies ·
The "Landlord of Orbit" – A Deep Value Play Ahead of the Starlab Era
Fair Value:US$385.291.0% undervalued
49 followersusers have followed this narrative
0 commentsusers have commented on this narrative
5 likesusers have liked this narrative
IV

Ivoed on Uber Technologies ·
Uber’s Valuation Depends On Who Captures The Economics Of Driverless Rides
Fair Value:US$11632.3% undervalued
12 followersusers have followed this narrative
0 commentsusers have commented on this narrative
3 likesusers have liked this narrative
Recently Updated Narratives
JO


John_Eric on Veeva Systems ·
AI-Powered Veeva Systems Poised for Solid Growth Amid Regulatory Stability
Fair Value:US$383.1436.1% undervalued
45 followersusers have followed this narrative
0 commentsusers have commented on this narrative
0 likesusers have liked this narrative
LU


LunaRodas on NVIDIA ·
NVDA | Nvidia Corporation: What They Said vs. What They Did
Fair Value:US$315.0333.4% undervalued
1 followerusers have followed this narrative
0 commentsusers have commented on this narrative
0 likesusers have liked this narrative
IN

InvestingNurse on Lexaria Bioscience ·
Lexaria Bioscience's Breakthrough with DehydraTECH to Revolutionize Drug Delivery
Fair Value:US$2352.0% undervalued
4 followersusers have followed this narrative
0 commentsusers have commented on this narrative
0 likesusers have liked this narrative
Popular Narratives
OS

oscargarcia on NVIDIA ·
The company that went from selling GPUs to gamers to becoming the AI arms dealer of the 21st century.
Fair Value:US$28025.1% undervalued
360 followersusers have followed this narrative
9 commentsusers have commented on this narrative
16 likesusers have liked this narrative
CU

CubanEros on Microsoft ·
A wonderful business at reasonable price.
Fair Value:US$419.9118.2% overvalued
207 followersusers have followed this narrative
0 commentsusers have commented on this narrative
9 likesusers have liked this narrative
KI

KiwiInvest on Amazon.com ·
Amazon's high growth, high tech segments propel its profits, while traditional segments plod along
Fair Value:US$475.0945.2% undervalued
232 followersusers have followed this narrative
1 commentusers have commented on this narrative
8 likesusers have liked this narrative


