Need To Know: This Analyst Just Made A Substantial Cut To Their S.P. Apparels Limited (NSE:SPAL) Estimates

The latest analyst coverage could presage a bad day for S.P. Apparels Limited (NSE:SPAL), with the covering analyst making across-the-board cuts to their statutory estimates that might leave shareholders a little shell-shocked. Both revenue and earnings per share (EPS) estimates were cut sharply as the analyst factored in the latest outlook for the business, concluding that they were too optimistic previously.
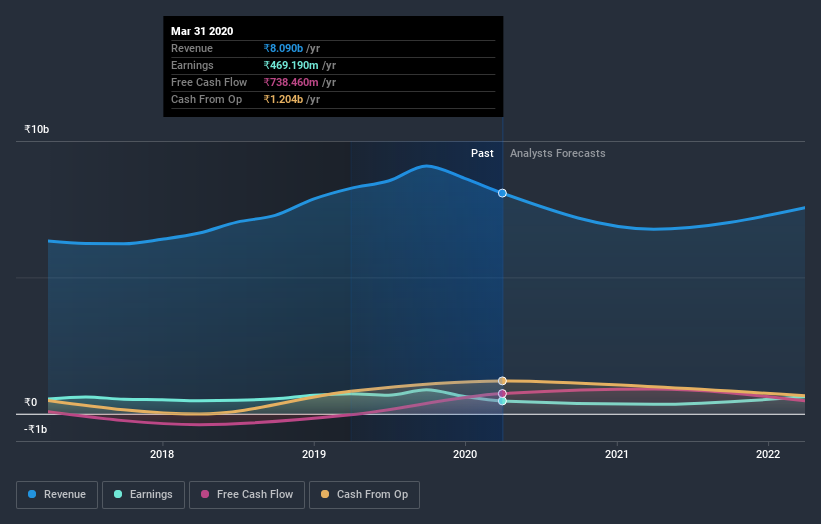
Following the latest downgrade, the current consensus, from the solo analyst covering S.P. Apparels, is for revenues of ₹6.8b in 2021, which would reflect a chunky 16% reduction in S.P. Apparels' sales over the past 12 months. Statutory earnings per share are anticipated to dive 27% to ₹13.40 in the same period. Prior to this update, the analyst had been forecasting revenues of ₹9.4b and earnings per share (EPS) of ₹31.21 in 2021. It looks like analyst sentiment has declined substantially, with a pretty serious reduction to revenue estimates and a pretty serious decline to earnings per share numbers as well.
Check out our latest analysis for S.P. Apparels

It'll come as no surprise then, to learn that the analyst has cut their price target 14% to ₹184. There's another way to think about price targets though, and that's to look at the range of price targets put forward by analysts, because a wide range of estimates could suggest a diverse view on possible outcomes for the business. There are some variant perceptions on S.P. Apparels, with the most bullish analyst valuing it at ₹222 and the most bearish at ₹144 per share. This shows there is still some diversity in estimates, but analysts don't appear to be totally split on the stock as though it might be a success or failure situation.
Looking at the bigger picture now, one of the ways we can make sense of these forecasts is to see how they measure up against both past performance and industry growth estimates. These estimates imply that sales are expected to slow, with a forecast revenue decline of 16%, a significant reduction from annual growth of 12% over the last five years. By contrast, our data suggests that other companies (with analyst coverage) in the same industry are forecast to see their revenue grow 9.1% annually for the foreseeable future. It's pretty clear that S.P. Apparels' revenues are expected to perform substantially worse than the wider industry.
The Bottom Line
The most important thing to take away is that the analyst cut their earnings per share estimates, expecting a clear decline in business conditions. Unfortunately the analyst also downgraded their revenue estimates, and industry data suggests that S.P. Apparels' revenues are expected to grow slower than the wider market. Given the scope of the downgrades, it would not be a surprise to see the market become more wary of the business.
That said, the analyst might have good reason to be negative on S.P. Apparels, given its declining profit margins. For more information, you can click here to discover this and the 3 other risks we've identified.
Of course, seeing company management invest large sums of money in a stock can be just as useful as knowing whether analysts are downgrading their estimates. So you may also wish to search this free list of stocks that insiders are buying.
If you’re looking to trade S.P. Apparels, open an account with the lowest-cost* platform trusted by professionals, Interactive Brokers. Their clients from over 200 countries and territories trade stocks, options, futures, forex, bonds and funds worldwide from a single integrated account.Promoted
New: Manage All Your Stock Portfolios in One Place
We've created the ultimate portfolio companion for stock investors, and it's free.
• Connect an unlimited number of Portfolios and see your total in one currency
• Be alerted to new Warning Signs or Risks via email or mobile
• Track the Fair Value of your stocks
This article by Simply Wall St is general in nature. It does not constitute a recommendation to buy or sell any stock, and does not take account of your objectives, or your financial situation. We aim to bring you long-term focused analysis driven by fundamental data. Note that our analysis may not factor in the latest price-sensitive company announcements or qualitative material. Simply Wall St has no position in any stocks mentioned.
*Interactive Brokers Rated Lowest Cost Broker by StockBrokers.com Annual Online Review 2020
Have feedback on this article? Concerned about the content? Get in touch with us directly. Alternatively, email editorial-team@simplywallst.com.
About NSEI:SPAL
S.P. Apparels
Engages in manufacturing and exporting of knitted garments for infants and children in India and internationally.
Flawless balance sheet and undervalued.

