Advertisement
- Australia
- /
- Hospitality
- /
- ASX:WEB
Insufficient Growth At Webjet Limited (ASX:WEB) Hampers Share Price
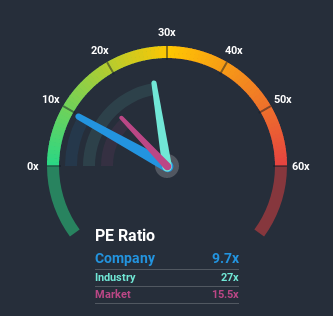
With a price-to-earnings (or "P/E") ratio of 9.7x Webjet Limited (ASX:WEB) may be sending bullish signals at the moment, given that almost half of all companies in Australia have P/E ratios greater than 16x and even P/E's higher than 30x are not unusual. Nonetheless, we'd need to dig a little deeper to determine if there is a rational basis for the reduced P/E.
Webjet could be doing better as its earnings have been going backwards lately while most other companies have been seeing positive earnings growth. The P/E is probably low because investors think this poor earnings performance isn't going to get any better. If this is the case, then existing shareholders will probably struggle to get excited about the future direction of the share price.
View our latest analysis for Webjet
How Does Webjet's P/E Ratio Compare To Its Industry Peers?
We'd like to see if P/E's within Webjet's industry might provide some colour around the company's low P/E ratio. The image below shows that the Online Retail industry as a whole has a P/E ratio significantly higher than the market. So unfortunately this doesn't provide much to explain the company's ratio at all right now. In the context of the Online Retail industry's current setting, most of its constituents' P/E's would be expected to be raised up greatly. Still, the strength of the company's earnings will most likely determine where its P/E shall sit.
Does Growth Match The Low P/E?
The only time you'd be truly comfortable seeing a P/E as low as Webjet's is when the company's growth is on track to lag the market.
Taking a look back first, the company's earnings per share growth last year wasn't something to get excited about as it posted a disappointing decline of 19%. This means it has also seen a slide in earnings over the longer-term as EPS is down 37% in total over the last three years. So unfortunately, we have to acknowledge that the company has not done a great job of growing earnings over that time.
Looking ahead now, EPS is anticipated to slump, contracting by 33% per annum during the coming three years according to the eight analysts following the company. That's not great when the rest of the market is expected to grow by 11% each year.
In light of this, it's understandable that Webjet's P/E would sit below the majority of other companies. However, shrinking earnings are unlikely to lead to a stable P/E over the longer term. There's potential for the P/E to fall to even lower levels if the company doesn't improve its profitability.
The Bottom Line On Webjet's P/E
While the price-to-earnings ratio shouldn't be the defining factor in whether you buy a stock or not, it's quite a capable barometer of earnings expectations.
We've established that Webjet maintains its low P/E on the weakness of its forecast for sliding earnings, as expected. Right now shareholders are accepting the low P/E as they concede future earnings probably won't provide any pleasant surprises. It's hard to see the share price rising strongly in the near future under these circumstances.
It's always necessary to consider the ever-present spectre of investment risk. We've identified 4 warning signs with Webjet (at least 1 which makes us a bit uncomfortable), and understanding them should be part of your investment process.
If you're unsure about the strength of Webjet's business, why not explore our interactive list of stocks with solid business fundamentals for some other companies you may have missed.
When trading Webjet or any other investment, use the platform considered by many to be the Professional's Gateway to the Worlds Market, Interactive Brokers. You get the lowest-cost* trading on stocks, options, futures, forex, bonds and funds worldwide from a single integrated account.Promoted
Valuation is complex, but we're here to simplify it.
Discover if Web Travel Group might be undervalued or overvalued with our detailed analysis, featuring fair value estimates, potential risks, dividends, insider trades, and its financial condition.
Access Free AnalysisThis article by Simply Wall St is general in nature. It does not constitute a recommendation to buy or sell any stock, and does not take account of your objectives, or your financial situation. We aim to bring you long-term focused analysis driven by fundamental data. Note that our analysis may not factor in the latest price-sensitive company announcements or qualitative material. Simply Wall St has no position in any stocks mentioned.
*Interactive Brokers Rated Lowest Cost Broker by StockBrokers.com Annual Online Review 2020
Have feedback on this article? Concerned about the content? Get in touch with us directly. Alternatively, email editorial-team@simplywallst.com.
About ASX:WEB
Web Travel Group
Provides online travel booking services in Australia, the United Arab Emirates, the United Kingdom, Spain, and internationally.
Reasonable growth potential with proven track record.
Similar Companies
Market Insights


Advertisement
Weekly Picks
LO


Lou_Basenese on Virtuix Holdings ·
From a “Shark Tank” Snub to an Air Force “Yes”: Why Virtuix at $3.50 May Be the Market’s Most Mispriced AI Story
Fair Value:US$7.551.2% undervalued
14 followersusers have followed this narrative
0 commentsusers have commented on this narrative
2 likesusers have liked this narrative
IN


Investingwilly on Mastercard ·
Mastercard: The Best Dividend Stock You're Ignoring
Fair Value:US$75034.1% undervalued
44 followersusers have followed this narrative
1 commentusers have commented on this narrative
6 likesusers have liked this narrative
TR


tripledub on Intuit ·
A Wonderful Business at a Not-So-Wonderful Price
Fair Value:US$56053.2% undervalued
61 followersusers have followed this narrative
2 commentsusers have commented on this narrative
29 likesusers have liked this narrative
TA


Talos on MindWalk Holdings ·
The Asymmetric TechBio Play: MindWalk Holdings and the Valuation Disconnect
Fair Value:US$8.2781.3% undervalued
30 followersusers have followed this narrative
0 commentsusers have commented on this narrative
8 likesusers have liked this narrative
Recently Updated Narratives
AN


AntonioS on Auckland International Airport ·
Auckland International Airport (AIA) - Quality is not the question, price is.
Fair Value:NZ$639.3% overvalued
1 followerusers have followed this narrative
0 commentsusers have commented on this narrative
0 likesusers have liked this narrative
BR


Brunhilde_Wagner on Gentex ·
Fair Value=$27; high-quality niche industrial w/ real moat; excellent FCF conversion.
Fair Value:US$24.641.6% overvalued
1 followerusers have followed this narrative
0 commentsusers have commented on this narrative
0 likesusers have liked this narrative
MA


martinarauz on Meta Platforms ·
Meta Platforms: A Cash Flow Machine in the Age of AI
Fair Value:US$983.343.3% undervalued
1 followerusers have followed this narrative
0 commentsusers have commented on this narrative
0 likesusers have liked this narrative
Popular Narratives
MA

martinarauz on Nu Holdings ·
Investment Analysis (May 2026)
Fair Value:US$22.7445.2% undervalued
67 followersusers have followed this narrative
0 commentsusers have commented on this narrative
16 likesusers have liked this narrative
HA


HarishPK on Adobe ·
Adobe: A Probabilistic Case for Undervaluation
Fair Value:US$319.9638.6% undervalued
61 followersusers have followed this narrative
9 commentsusers have commented on this narrative
18 likesusers have liked this narrative
HE


HedgeY on AST SpaceMobile ·
AST SpaceMobile: The Boldest Direct-to-Cell Bet in Public Markets
Fair Value:US$17060.0% undervalued
51 followersusers have followed this narrative
0 commentsusers have commented on this narrative
13 likesusers have liked this narrative
