- United Kingdom
- /
- Healthtech
- /
- AIM:CRW
If You Had Bought Craneware (LON:CRW) Shares Five Years Ago You'd Have Earned156% Returns


It hasn't been the best quarter for Craneware plc (LON:CRW) shareholders, since the share price has fallen 14% in that time. But that scarcely detracts from the really solid long term returns generated by the company over five years. We think most investors would be happy with the 156% return, over that period. So while it's never fun to see a share price fall, it's important to look at a longer time horizon. Ultimately business performance will determine whether the stock price continues the positive long term trend.
View our latest analysis for Craneware
There is no denying that markets are sometimes efficient, but prices do not always reflect underlying business performance. One imperfect but simple way to consider how the market perception of a company has shifted is to compare the change in the earnings per share (EPS) with the share price movement.
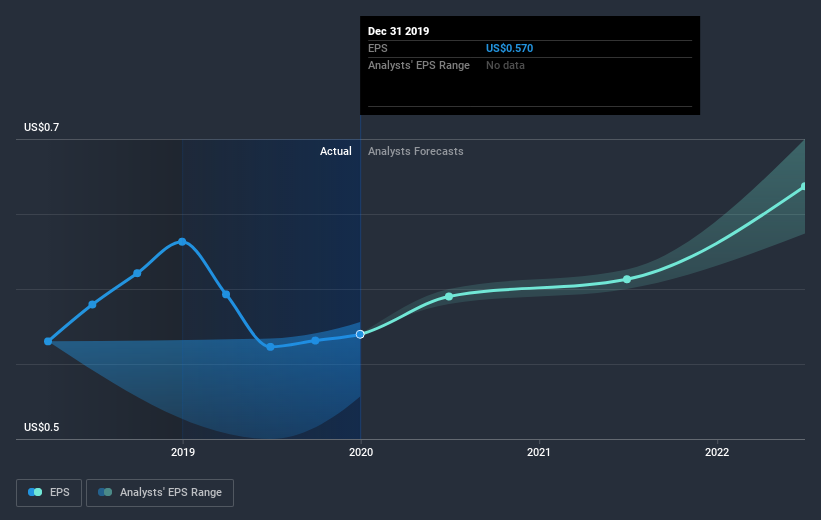
During five years of share price growth, Craneware achieved compound earnings per share (EPS) growth of 11% per year. This EPS growth is lower than the 21% average annual increase in the share price. So it's fair to assume the market has a higher opinion of the business than it did five years ago. That's not necessarily surprising considering the five-year track record of earnings growth.
You can see how EPS has changed over time in the image below (click on the chart to see the exact values).
We consider it positive that insiders have made significant purchases in the last year. Even so, future earnings will be far more important to whether current shareholders make money. Dive deeper into the earnings by checking this interactive graph of Craneware's earnings, revenue and cash flow.
What About Dividends?
When looking at investment returns, it is important to consider the difference between total shareholder return (TSR) and share price return. The TSR is a return calculation that accounts for the value of cash dividends (assuming that any dividend received was reinvested) and the calculated value of any discounted capital raisings and spin-offs. It's fair to say that the TSR gives a more complete picture for stocks that pay a dividend. In the case of Craneware, it has a TSR of 174% for the last 5 years. That exceeds its share price return that we previously mentioned. The dividends paid by the company have thusly boosted the total shareholder return.
A Different Perspective
Although it hurts that Craneware returned a loss of 1.2% in the last twelve months, the broader market was actually worse, returning a loss of 9.7%. Of course, the long term returns are far more important and the good news is that over five years, the stock has returned 22% for each year. It could be that the business is just facing some short term problems, but shareholders should keep a close eye on the fundamentals. If you want to research this stock further, the data on insider buying is an obvious place to start. You can click here to see who has been buying shares - and the price they paid.
There are plenty of other companies that have insiders buying up shares. You probably do not want to miss this free list of growing companies that insiders are buying.
Please note, the market returns quoted in this article reflect the market weighted average returns of stocks that currently trade on GB exchanges.
If you decide to trade Craneware, use the lowest-cost* platform that is rated #1 Overall by Barron’s, Interactive Brokers. Trade stocks, options, futures, forex, bonds and funds on 135 markets, all from a single integrated account.Promoted
New: AI Stock Screener & Alerts
Our new AI Stock Screener scans the market every day to uncover opportunities.
• Dividend Powerhouses (3%+ Yield)
• Undervalued Small Caps with Insider Buying
• High growth Tech and AI Companies
Or build your own from over 50 metrics.
This article by Simply Wall St is general in nature. It does not constitute a recommendation to buy or sell any stock, and does not take account of your objectives, or your financial situation. We aim to bring you long-term focused analysis driven by fundamental data. Note that our analysis may not factor in the latest price-sensitive company announcements or qualitative material. Simply Wall St has no position in any stocks mentioned.
*Interactive Brokers Rated Lowest Cost Broker by StockBrokers.com Annual Online Review 2020
Have feedback on this article? Concerned about the content? Get in touch with us directly. Alternatively, email editorial-team@simplywallst.com.
About AIM:CRW
Craneware
Develops, licenses, and supports computer software for the healthcare industry in the United States.
Reasonable growth potential with proven track record and pays a dividend.
Similar Companies
Market Insights

Community Narratives

