Advertisement
- United Kingdom
- /
- Industrials
- /
- LSE:SMIN
How Does Smiths Group's (LON:SMIN) P/E Compare To Its Industry, After The Share Price Drop?
Unfortunately for some shareholders, the Smiths Group (LON:SMIN) share price has dived 33% in the last thirty days. The recent drop has obliterated the annual return, with the share price now down 23% over that longer period.
All else being equal, a share price drop should make a stock more attractive to potential investors. In the long term, share prices tend to follow earnings per share, but in the short term prices bounce around in response to short term factors (which are not always obvious). So, on certain occasions, long term focussed investors try to take advantage of pessimistic expectations to buy shares at a better price. One way to gauge market expectations of a stock is to look at its Price to Earnings Ratio (PE Ratio). A high P/E ratio means that investors have a high expectation about future growth, while a low P/E ratio means they have low expectations about future growth.
View our latest analysis for Smiths Group
Does Smiths Group Have A Relatively High Or Low P/E For Its Industry?
We can tell from its P/E ratio of 31.19 that there is some investor optimism about Smiths Group. The image below shows that Smiths Group has a higher P/E than the average (11.3) P/E for companies in the industrials industry.
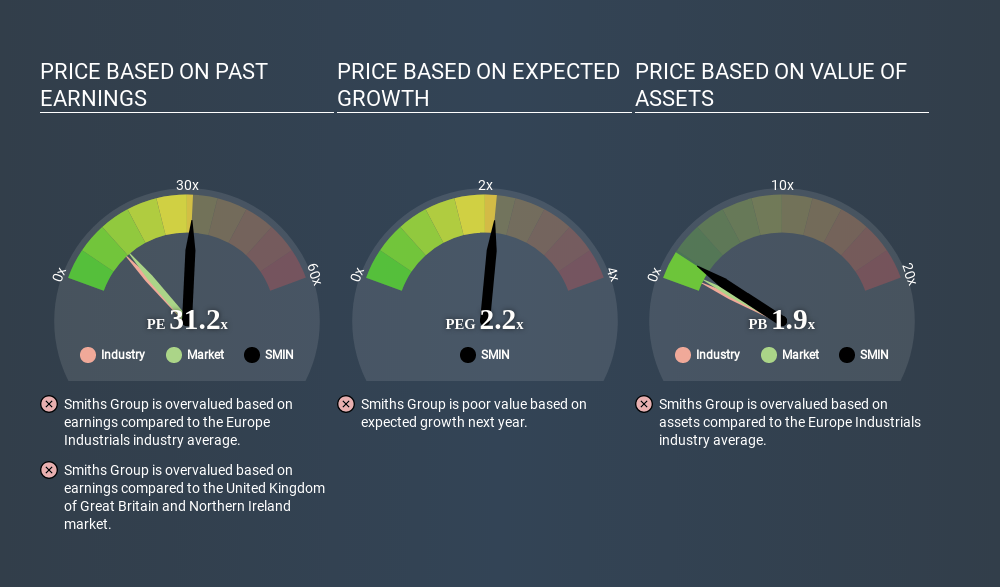
Smiths Group's P/E tells us that market participants think the company will perform better than its industry peers, going forward. Clearly the market expects growth, but it isn't guaranteed. So investors should delve deeper. I like to check if company insiders have been buying or selling.
How Growth Rates Impact P/E Ratios
If earnings fall then in the future the 'E' will be lower. That means unless the share price falls, the P/E will increase in a few years. A higher P/E should indicate the stock is expensive relative to others -- and that may encourage shareholders to sell.
It's great to see that Smiths Group grew EPS by 20% in the last year. In contrast, EPS has decreased by 9.8%, annually, over 5 years.
Remember: P/E Ratios Don't Consider The Balance Sheet
One drawback of using a P/E ratio is that it considers market capitalization, but not the balance sheet. That means it doesn't take debt or cash into account. In theory, a company can lower its future P/E ratio by using cash or debt to invest in growth.
Such spending might be good or bad, overall, but the key point here is that you need to look at debt to understand the P/E ratio in context.
Smiths Group's Balance Sheet
Smiths Group has net debt equal to 28% of its market cap. You'd want to be aware of this fact, but it doesn't bother us.
The Bottom Line On Smiths Group's P/E Ratio
Smiths Group has a P/E of 31.2. That's higher than the average in its market, which is 12.5. While the company does use modest debt, its recent earnings growth is very good. So on this analysis it seems reasonable that its P/E ratio is above average. Given Smiths Group's P/E ratio has declined from 46.9 to 31.2 in the last month, we know for sure that the market is significantly less confident about the business today, than it was back then. For those who don't like to trade against momentum, that could be a warning sign, but a contrarian investor might want to take a closer look.
Investors should be looking to buy stocks that the market is wrong about. People often underestimate remarkable growth -- so investors can make money when fast growth is not fully appreciated. So this free visual report on analyst forecasts could hold the key to an excellent investment decision.
Of course, you might find a fantastic investment by looking at a few good candidates. So take a peek at this free list of companies with modest (or no) debt, trading on a P/E below 20.
If you spot an error that warrants correction, please contact the editor at editorial-team@simplywallst.com. This article by Simply Wall St is general in nature. It does not constitute a recommendation to buy or sell any stock, and does not take account of your objectives, or your financial situation. Simply Wall St has no position in the stocks mentioned.
We aim to bring you long-term focused research analysis driven by fundamental data. Note that our analysis may not factor in the latest price-sensitive company announcements or qualitative material. Thank you for reading.
About LSE:SMIN
Smiths Group
Operates as an industrial technology company in Americas, Europe, the Asia Pacific, and internationally.
Adequate balance sheet with acceptable track record.
Similar Companies
Market Insights


Advertisement
Weekly Picks
CE


Ceazar on Eva Live ·
This small cap is building the AI workforce of the future
Fair Value:US$7.4351.3% undervalued
76 followersusers have followed this narrative
0 commentsusers have commented on this narrative
16 likesusers have liked this narrative
TR


tripledub on lululemon athletica ·
Lululemon Got Boring Right About the Time It Got Cheap. That's Usually the Point
Fair Value:US$22042.2% undervalued
26 followersusers have followed this narrative
6 commentsusers have commented on this narrative
27 likesusers have liked this narrative
WO


woodworthfund on Kraft Heinz ·
Kraft Heinz (KHC): Less Drama, More Ketchup
Fair Value:US$3532.0% undervalued
8 followersusers have followed this narrative
0 commentsusers have commented on this narrative
2 likesusers have liked this narrative
CA


Canderous on PetroTal ·
Beyond 2026, Beyond a Double
Fair Value:CA$1.8166.9% undervalued
28 followersusers have followed this narrative
0 commentsusers have commented on this narrative
5 likesusers have liked this narrative
Recently Updated Narratives
WA

wahyud on Perusahaan Perkebunan London Sumatra Indonesia ·
LSIP Revenue to Rise a Whopping 43.92% Amid Market Dynamics
Fair Value:Rp3.6k63.5% undervalued
1 followerusers have followed this narrative
0 commentsusers have commented on this narrative
0 likesusers have liked this narrative
WA

wahyud on Charoen Pokphand Indonesia ·
Charoen Pokphand Indonesia will soar with a 12.94% growth and a 10.67x future P/E
Fair Value:Rp4.53k4.0% undervalued
1 followerusers have followed this narrative
0 commentsusers have commented on this narrative
0 likesusers have liked this narrative
WA

wahyud on Medco Energi Internasional ·
Medco Energi's Revenue Will Increase by 2.45% Doors Opening
Fair Value:Rp1.75k23.4% undervalued
1 followerusers have followed this narrative
0 commentsusers have commented on this narrative
0 likesusers have liked this narrative
Popular Narratives
GO

GoldenSands on QuantumScape ·
QuantumScape: A Mispriced Deep‑Tech Inflection Point With Multi‑Billion‑Dollar Optionality
Fair Value:US$8590.4% undervalued
113 followersusers have followed this narrative
2 commentsusers have commented on this narrative
31 likesusers have liked this narrative
AN


AnalystConsensusTarget on NVIDIA ·
NVDA: Expanding AI Demand Will Drive Major Data Center Investments Through 2026
Fair Value:US$268.6119.8% undervalued
1194 followersusers have followed this narrative
7 commentsusers have commented on this narrative
34 likesusers have liked this narrative
TR
tripledub on lululemon athletica ·
Lululemon Got Boring Right About the Time It Got Cheap. That's Usually the Point
Fair Value:US$22042.2% undervalued
26 followersusers have followed this narrative
6 commentsusers have commented on this narrative
27 likesusers have liked this narrative

