Advertisement
- United States
- /
- Commercial Services
- /
- NasdaqGS:TILE
How Does Interface's (NASDAQ:TILE) P/E Compare To Its Industry, After Its Big Share Price Gain?
Those holding Interface (NASDAQ:TILE) shares must be pleased that the share price has rebounded 45% in the last thirty days. But unfortunately, the stock is still down by 45% over a quarter. But shareholders may not all be feeling jubilant, since the share price is still down 47% in the last year.
Assuming no other changes, a sharply higher share price makes a stock less attractive to potential buyers. While the market sentiment towards a stock is very changeable, in the long run, the share price will tend to move in the same direction as earnings per share. The implication here is that deep value investors might steer clear when expectations of a company are too high. Perhaps the simplest way to get a read on investors' expectations of a business is to look at its Price to Earnings Ratio (PE Ratio). A high P/E ratio means that investors have a high expectation about future growth, while a low P/E ratio means they have low expectations about future growth.
View our latest analysis for Interface
How Does Interface's P/E Ratio Compare To Its Peers?
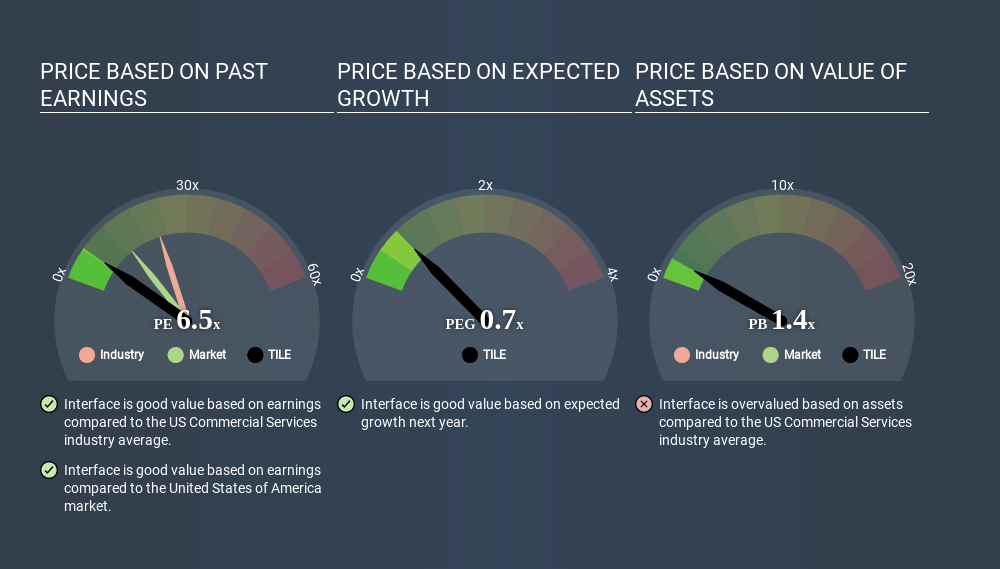
Interface's P/E of 6.55 indicates relatively low sentiment towards the stock. The image below shows that Interface has a lower P/E than the average (22.4) P/E for companies in the commercial services industry.
Interface's P/E tells us that market participants think it will not fare as well as its peers in the same industry. Since the market seems unimpressed with Interface, it's quite possible it could surprise on the upside. If you consider the stock interesting, further research is recommended. For example, I often monitor director buying and selling.
How Growth Rates Impact P/E Ratios
Generally speaking the rate of earnings growth has a profound impact on a company's P/E multiple. When earnings grow, the 'E' increases, over time. Therefore, even if you pay a high multiple of earnings now, that multiple will become lower in the future. And as that P/E ratio drops, the company will look cheap, unless its share price increases.
Interface's 59% EPS improvement over the last year was like bamboo growth after rain; rapid and impressive. The sweetener is that the annual five year growth rate of 29% is also impressive. With that kind of growth rate we would generally expect a high P/E ratio.
Don't Forget: The P/E Does Not Account For Debt or Bank Deposits
Don't forget that the P/E ratio considers market capitalization. That means it doesn't take debt or cash into account. Hypothetically, a company could reduce its future P/E ratio by spending its cash (or taking on debt) to achieve higher earnings.
Spending on growth might be good or bad a few years later, but the point is that the P/E ratio does not account for the option (or lack thereof).
So What Does Interface's Balance Sheet Tell Us?
Interface's net debt is considerable, at 101% of its market cap. This level of debt justifies a relatively low P/E, so remain cognizant of the debt, if you're comparing it to other stocks.
The Verdict On Interface's P/E Ratio
Interface's P/E is 6.5 which is below average (13.6) in the US market. While the EPS growth last year was strong, the significant debt levels reduce the number of options available to management. The low P/E ratio suggests current market expectations are muted, implying these levels of growth will not continue. What we know for sure is that investors are becoming less uncomfortable about Interface's prospects, since they have pushed its P/E ratio from 4.5 to 6.5 over the last month. If you like to buy stocks that could be turnaround opportunities, then this one might be a candidate; but if you're more sensitive to price, then you may feel the opportunity has passed.
Investors should be looking to buy stocks that the market is wrong about. If it is underestimating a company, investors can make money by buying and holding the shares until the market corrects itself. So this free visualization of the analyst consensus on future earnings could help you make the right decision about whether to buy, sell, or hold.
Of course you might be able to find a better stock than Interface. So you may wish to see this free collection of other companies that have grown earnings strongly.
If you spot an error that warrants correction, please contact the editor at editorial-team@simplywallst.com. This article by Simply Wall St is general in nature. It does not constitute a recommendation to buy or sell any stock, and does not take account of your objectives, or your financial situation. Simply Wall St has no position in the stocks mentioned.
We aim to bring you long-term focused research analysis driven by fundamental data. Note that our analysis may not factor in the latest price-sensitive company announcements or qualitative material. Thank you for reading.
About NasdaqGS:TILE
Interface
Designs, produces, and sells modular carpet products in the United States, Canada, Latin America, Europe, Africa, Asia, and Australia.
Flawless balance sheet and undervalued.
Similar Companies
Market Insights


Advertisement
Weekly Picks
CE


Ceazar on Conexeu Sciences ·
This small biotech is developing technology that could potentially change how tissue is rebuilt
Fair Value:US$25.3447.6% undervalued
30 followersusers have followed this narrative
0 commentsusers have commented on this narrative
3 likesusers have liked this narrative
HE


HedgeY on Quanta Services ·
The Picks-and-Shovels Leader of the Grid Supercycle
Fair Value:US$7101.1% undervalued
50 followersusers have followed this narrative
0 commentsusers have commented on this narrative
4 likesusers have liked this narrative
FU

FundamentalFlow on Karman Holdings ·
KRMN — Karman Space & Defense: Down 58% from Peak, Is the Market Mispricing a Hypergrowth Defense Compounder?
Fair Value:US$105.652.3% undervalued
28 followersusers have followed this narrative
2 commentsusers have commented on this narrative
13 likesusers have liked this narrative
DO


Double_Bubbler on Invinity Energy Systems ·
Invinity Energy Systems: All About That BESS
Fair Value:UK£162.2% undervalued
36 followersusers have followed this narrative
0 commentsusers have commented on this narrative
5 likesusers have liked this narrative
Recently Updated Narratives
RO


RockeTeller on American Resources ·
American Resources, $263M Market Cap + 19% ReElement Stake, From Coal to Critical Minerals
Fair Value:US$557.0% undervalued
3 followersusers have followed this narrative
0 commentsusers have commented on this narrative
0 likesusers have liked this narrative
HU

Hunter_Z on EPB Group Berhad ·
EPB: Strong Shareholder Backing, Continuous Insider Buying and Growth Opportunities Ahead
Fair Value:RM 0.548.0% undervalued
2 followersusers have followed this narrative
0 commentsusers have commented on this narrative
0 likesusers have liked this narrative
YO
youwakeup on Harvest Strategy Enhanced High Income Shares ETF ·
MSTE: Turning Bitcoin Volatility Into Monthly Cash Flow
Fair Value:CA$11.7579.6% undervalued
1 followerusers have followed this narrative
0 commentsusers have commented on this narrative
0 likesusers have liked this narrative
Popular Narratives
MA


martinarauz on Nu Holdings ·
Investment Analysis (May 2026)
Fair Value:US$22.7444.1% undervalued
68 followersusers have followed this narrative
0 commentsusers have commented on this narrative
16 likesusers have liked this narrative
HA


HarishPK on Adobe ·
Adobe: A Probabilistic Case for Undervaluation
Fair Value:US$319.9639.0% undervalued
57 followersusers have followed this narrative
9 commentsusers have commented on this narrative
17 likesusers have liked this narrative
NI


niteco on Honeywell International ·
Honeywell - The Demand-Side of the AI Infrastructure
Fair Value:US$320.1928.5% undervalued
52 followersusers have followed this narrative
0 commentsusers have commented on this narrative
19 likesusers have liked this narrative


