Advertisement
- United States
- /
- Trade Distributors
- /
- NYSE:GMS
How Does GMS's (NYSE:GMS) P/E Compare To Its Industry, After The Share Price Drop?
To the annoyance of some shareholders, GMS (NYSE:GMS) shares are down a considerable 30% in the last month. Looking back over the last year, the stock has been a solid performer, with a gain of 16%.
Assuming nothing else has changed, a lower share price makes a stock more attractive to potential buyers. While the market sentiment towards a stock is very changeable, in the long run, the share price will tend to move in the same direction as earnings per share. So, on certain occasions, long term focussed investors try to take advantage of pessimistic expectations to buy shares at a better price. One way to gauge market expectations of a stock is to look at its Price to Earnings Ratio (PE Ratio). Investors have optimistic expectations of companies with higher P/E ratios, compared to companies with lower P/E ratios.
See our latest analysis for GMS
How Does GMS's P/E Ratio Compare To Its Peers?
GMS's P/E of 9.84 indicates relatively low sentiment towards the stock. The image below shows that GMS has a lower P/E than the average (13.1) P/E for companies in the trade distributors industry.
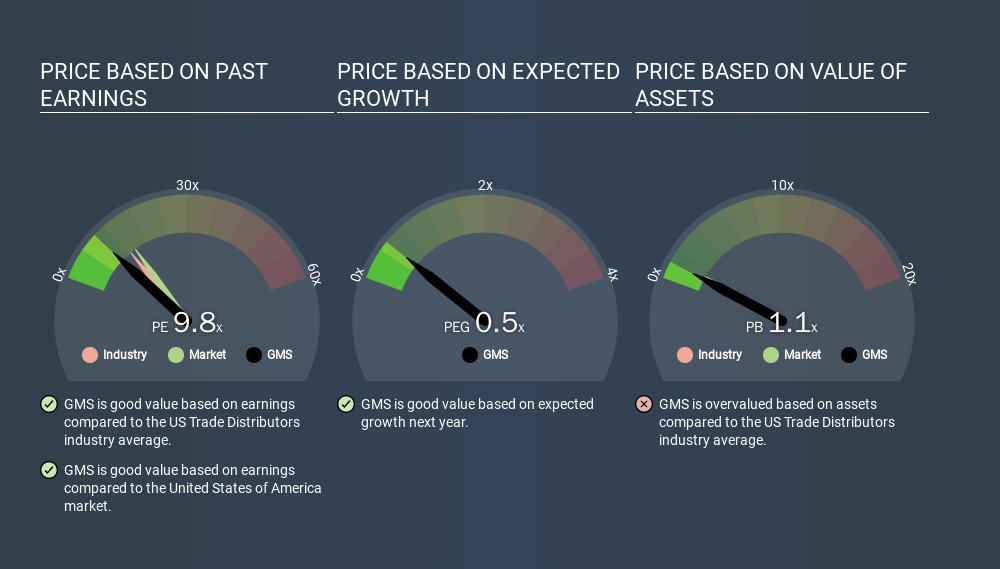
GMS's P/E tells us that market participants think it will not fare as well as its peers in the same industry. While current expectations are low, the stock could be undervalued if the situation is better than the market assumes. If you consider the stock interesting, further research is recommended. For example, I often monitor director buying and selling.
How Growth Rates Impact P/E Ratios
Generally speaking the rate of earnings growth has a profound impact on a company's P/E multiple. If earnings are growing quickly, then the 'E' in the equation will increase faster than it would otherwise. Therefore, even if you pay a high multiple of earnings now, that multiple will become lower in the future. A lower P/E should indicate the stock is cheap relative to others -- and that may attract buyers.
GMS's 66% EPS improvement over the last year was like bamboo growth after rain; rapid and impressive. And earnings per share have improved by 20% annually, over the last three years. So you might say it really deserves to have an above-average P/E ratio.
A Limitation: P/E Ratios Ignore Debt and Cash In The Bank
One drawback of using a P/E ratio is that it considers market capitalization, but not the balance sheet. Thus, the metric does not reflect cash or debt held by the company. Theoretically, a business can improve its earnings (and produce a lower P/E in the future) by investing in growth. That means taking on debt (or spending its cash).
Such expenditure might be good or bad, in the long term, but the point here is that the balance sheet is not reflected by this ratio.
GMS's Balance Sheet
Net debt totals a substantial 113% of GMS's market cap. If you want to compare its P/E ratio to other companies, you must keep in mind that these debt levels would usually warrant a relatively low P/E.
The Bottom Line On GMS's P/E Ratio
GMS trades on a P/E ratio of 9.8, which is below the US market average of 14.7. The company may have significant debt, but EPS growth was good last year. If the company can continue to grow earnings, then the current P/E may be unjustifiably low. What can be absolutely certain is that the market has become more pessimistic about GMS over the last month, with the P/E ratio falling from 14.1 back then to 9.8 today. For those who prefer to invest with the flow of momentum, that might be a bad sign, but for deep value investors this stock might justify some research.
Investors should be looking to buy stocks that the market is wrong about. As value investor Benjamin Graham famously said, 'In the short run, the market is a voting machine but in the long run, it is a weighing machine. So this free visualization of the analyst consensus on future earnings could help you make the right decision about whether to buy, sell, or hold.
But note: GMS may not be the best stock to buy. So take a peek at this free list of interesting companies with strong recent earnings growth (and a P/E ratio below 20).
If you spot an error that warrants correction, please contact the editor at editorial-team@simplywallst.com. This article by Simply Wall St is general in nature. It does not constitute a recommendation to buy or sell any stock, and does not take account of your objectives, or your financial situation. Simply Wall St has no position in the stocks mentioned.
We aim to bring you long-term focused research analysis driven by fundamental data. Note that our analysis may not factor in the latest price-sensitive company announcements or qualitative material. Thank you for reading.
About NYSE:GMS
GMS
Gypsum Management & Supply Inc. operates a network of distribution centers that offer wallboard, ceilings, steel framing, and complementary construction products in the United States and Canada.
Adequate balance sheet and fair value.
Similar Companies
Market Insights


Advertisement
Weekly Picks
LO


Lou_Basenese on Virtuix Holdings ·
From a “Shark Tank” Snub to an Air Force “Yes”: Why Virtuix at $3.50 May Be the Market’s Most Mispriced AI Story
Fair Value:US$7.551.2% undervalued
9 followersusers have followed this narrative
0 commentsusers have commented on this narrative
1 likeusers have liked this narrative
IN


Investingwilly on Mastercard ·
Mastercard: The Best Dividend Stock You're Ignoring
Fair Value:US$75034.9% undervalued
36 followersusers have followed this narrative
1 commentusers have commented on this narrative
5 likesusers have liked this narrative
TR


tripledub on Intuit ·
A Wonderful Business at a Not-So-Wonderful Price
Fair Value:US$56053.9% undervalued
55 followersusers have followed this narrative
2 commentsusers have commented on this narrative
28 likesusers have liked this narrative
TA


Talos on MindWalk Holdings ·
The Asymmetric TechBio Play: MindWalk Holdings and the Valuation Disconnect
Fair Value:US$8.2782.0% undervalued
24 followersusers have followed this narrative
0 commentsusers have commented on this narrative
6 likesusers have liked this narrative
Recently Updated Narratives
MA

Maturity_Koala_snzw on VivoPower ·
Rating: Speculative Buy
Fair Value:US$937.8% undervalued
2 followersusers have followed this narrative
0 commentsusers have commented on this narrative
0 likesusers have liked this narrative
AS


AstrisCorporateAdvisory on Arr Planner ·
Forecasting another record year in FY1/2027
Fair Value:JP¥1.49k4.1% undervalued
2 followersusers have followed this narrative
0 commentsusers have commented on this narrative
0 likesusers have liked this narrative
AS

AstrisCorporateAdvisory on Iino Kaiun Kaisha ·
New MTP outlines a period of transformation
Fair Value:JP¥1.22k14.2% overvalued
1 followerusers have followed this narrative
0 commentsusers have commented on this narrative
0 likesusers have liked this narrative
Popular Narratives
MA


martinarauz on Nu Holdings ·
Investment Analysis (May 2026)
Fair Value:US$22.7444.6% undervalued
67 followersusers have followed this narrative
0 commentsusers have commented on this narrative
16 likesusers have liked this narrative
HA


HarishPK on Adobe ·
Adobe: A Probabilistic Case for Undervaluation
Fair Value:US$319.9638.3% undervalued
61 followersusers have followed this narrative
9 commentsusers have commented on this narrative
18 likesusers have liked this narrative
HE


HedgeY on AST SpaceMobile ·
AST SpaceMobile: The Boldest Direct-to-Cell Bet in Public Markets
Fair Value:US$17057.1% undervalued
51 followersusers have followed this narrative
0 commentsusers have commented on this narrative
13 likesusers have liked this narrative
