Advertisement
- United Kingdom
- /
- Trade Distributors
- /
- LSE:RS1
How Does Electrocomponents's (LON:ECM) P/E Compare To Its Industry, After The Share Price Drop?
To the annoyance of some shareholders, Electrocomponents (LON:ECM) shares are down a considerable 35% in the last month. Even longer term holders have taken a real hit with the stock declining 17% in the last year.
All else being equal, a share price drop should make a stock more attractive to potential investors. In the long term, share prices tend to follow earnings per share, but in the short term prices bounce around in response to short term factors (which are not always obvious). So, on certain occasions, long term focussed investors try to take advantage of pessimistic expectations to buy shares at a better price. Perhaps the simplest way to get a read on investors' expectations of a business is to look at its Price to Earnings Ratio (PE Ratio). A high P/E ratio means that investors have a high expectation about future growth, while a low P/E ratio means they have low expectations about future growth.
Check out our latest analysis for Electrocomponents
How Does Electrocomponents's P/E Ratio Compare To Its Peers?
Electrocomponents's P/E is 14.08. You can see in the image below that the average P/E (13.4) for companies in the electronic industry is roughly the same as Electrocomponents's P/E.
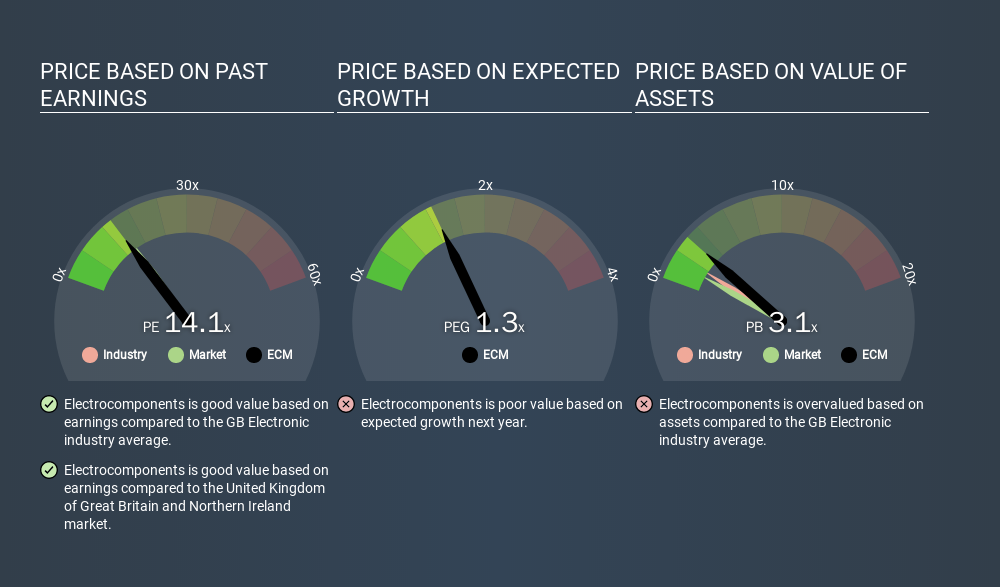
That indicates that the market expects Electrocomponents will perform roughly in line with other companies in its industry. The company could surprise by performing better than average, in the future. Further research into factors such as insider buying and selling, could help you form your own view on whether that is likely.
How Growth Rates Impact P/E Ratios
Generally speaking the rate of earnings growth has a profound impact on a company's P/E multiple. Earnings growth means that in the future the 'E' will be higher. That means even if the current P/E is high, it will reduce over time if the share price stays flat. And as that P/E ratio drops, the company will look cheap, unless its share price increases.
Electrocomponents shrunk earnings per share by 12% over the last year. But it has grown its earnings per share by 12% per year over the last five years.
Remember: P/E Ratios Don't Consider The Balance Sheet
It's important to note that the P/E ratio considers the market capitalization, not the enterprise value. That means it doesn't take debt or cash into account. In theory, a company can lower its future P/E ratio by using cash or debt to invest in growth.
While growth expenditure doesn't always pay off, the point is that it is a good option to have; but one that the P/E ratio ignores.
Is Debt Impacting Electrocomponents's P/E?
Net debt totals just 7.8% of Electrocomponents's market cap. It would probably trade on a higher P/E ratio if it had a lot of cash, but I doubt it is having a big impact.
The Bottom Line On Electrocomponents's P/E Ratio
Electrocomponents trades on a P/E ratio of 14.1, which is fairly close to the GB market average of 13.9. With modest debt, and a lack of recent growth, it would seem the market is expecting improvement in earnings. Given Electrocomponents's P/E ratio has declined from 21.6 to 14.1 in the last month, we know for sure that the market is significantly less confident about the business today, than it was back then. For those who prefer to invest with the flow of momentum, that might be a bad sign, but for a contrarian, it may signal opportunity.
When the market is wrong about a stock, it gives savvy investors an opportunity. People often underestimate remarkable growth -- so investors can make money when fast growth is not fully appreciated. So this free report on the analyst consensus forecasts could help you make a master move on this stock.
You might be able to find a better buy than Electrocomponents. If you want a selection of possible winners, check out this free list of interesting companies that trade on a P/E below 20 (but have proven they can grow earnings).
If you spot an error that warrants correction, please contact the editor at editorial-team@simplywallst.com. This article by Simply Wall St is general in nature. It does not constitute a recommendation to buy or sell any stock, and does not take account of your objectives, or your financial situation. Simply Wall St has no position in the stocks mentioned.
We aim to bring you long-term focused research analysis driven by fundamental data. Note that our analysis may not factor in the latest price-sensitive company announcements or qualitative material. Thank you for reading.
About LSE:RS1
RS Group
Engages in the distribution of maintenance, repair, and operations products and service solutions in the United Kingdom, the United States, France, Mexico, Germany, Italy, Switzerland, and internationally.
Excellent balance sheet established dividend payer.
Similar Companies
Market Insights

Advertisement
Weekly Picks
LO


Lou_Basenese on Optimi Health ·
The Only Psychedelic Company Already Selling MDMA and Psilocybin to Real Patients, Yet Priced Like It Doesn’t Exist
Fair Value:US$1158.7% undervalued
32 followersusers have followed this narrative
2 commentsusers have commented on this narrative
6 likesusers have liked this narrative
WE


WealthAP on Novo Nordisk ·
Novo Nordisk (NVO): Is the "Easy Growth" Story Over?
Fair Value:DKK 407.7721.6% undervalued
49 followersusers have followed this narrative
0 commentsusers have commented on this narrative
5 likesusers have liked this narrative
VA


ValueInvestingSubstack on Zoetis ·
Zoetis down -50% over the past year
Fair Value:US$92.9220.2% undervalued
15 followersusers have followed this narrative
0 commentsusers have commented on this narrative
7 likesusers have liked this narrative
CE


CentryResearch on Centrus Energy ·
Centrus Energy: The Next Nuclear Bottleneck Isn't Reactors. It's Fuel.
Fair Value:US$1908.3% undervalued
11 followersusers have followed this narrative
0 commentsusers have commented on this narrative
7 likesusers have liked this narrative
Recently Updated Narratives
RE


Reex on Unibap Space Solutions ·
Long-term bet on Europe's strategic space autonomy (2030–2055)
Fair Value:SEK 36.0176.8% undervalued
1 followerusers have followed this narrative
0 commentsusers have commented on this narrative
0 likesusers have liked this narrative
AV

Averagemike on Samsara ·
Samsara's Future PE Will Soar to 337.7x and the Future is Bright
Fair Value:US$57.34k99.9% undervalued
1 followerusers have followed this narrative
0 commentsusers have commented on this narrative
0 likesusers have liked this narrative
JO


John_Eric on ServiceNow ·
The Company Nobody Brags About
Fair Value:US$266.0164.1% undervalued
31 followersusers have followed this narrative
0 commentsusers have commented on this narrative
0 likesusers have liked this narrative
Popular Narratives
IN


Investingwilly on Mastercard ·
Mastercard: The Best Dividend Stock You're Ignoring
Fair Value:US$75029.1% undervalued
103 followersusers have followed this narrative
1 commentusers have commented on this narrative
9 likesusers have liked this narrative
BE

benjamin_lvieq on PayPal Holdings ·
PayPal: PayPal Doesn't Need to Grow – It Needs to Stop Falling – A Mispriced Cash Machine With a Cannibal Buyback
Fair Value:US$6514.6% undervalued
69 followersusers have followed this narrative
2 commentsusers have commented on this narrative
11 likesusers have liked this narrative
BL


BlackGoat on Cerebras Systems ·
The Wafer Giant Threatening NVIDIA's GPU Hegemony
Fair Value:US$415.5449.5% undervalued
64 followersusers have followed this narrative
3 commentsusers have commented on this narrative
11 likesusers have liked this narrative
Trending Discussion


ST


StoxEurope on Koninklijke Ahold Delhaize ·
I ran Ahold Delhaize through a three-model triangulation — DCF, dividend discount, and residual income — with every assumption published and tagged as fact or assumption. The interesting result isn't a number, it's a disagreement: the point estimates run from €20,03 (RIM) through €27,64 (DDM) to €64,91 (DCF), and the pairwise overlaps form two disjoint segments — €20,36–€21,54 and €39,60–€44,56. Between €21,54 and €39,60, no two of the three models agree. [img]https://staticm.fastcomments.com/1784197249786-1000x1000-ad-range-strip.png[/img] Most of the spread is lens properties rather than company drama. A dividend model structurally can't see the roughly half of shareholder returns Ahold pays through buybacks. The book is ~96 % goodwill from the 2016 merger, which pins the residual-income reading low. And ~83 % of the DCF's value sits beyond the explicit five years, so it leans hard on the terminal assumptions. Three honest lenses, three honest answers — the disagreement is the information. Disclosures Position disclosure: The author holds no position in Ahold Delhaize as at 9 July 2026. This valuation is a StoxEurope opinion, based on honest research. Mistakes are possible. This is not investment advice. Do your own research. This article demonstrates a valuation methodology. It is not an investment recommendation, is not personalised to any reader's circumstances, and every figure in it depends entirely on the stated assumptions
1
|0
PI


PittTheYounger on International Consolidated Airlines Group ·
IAG is a surefire investment in the airline space, once and if the Iran War is finally over in the sense of a lasting peace agreement or at least a reliable ceasefire. Before that, however and by the same token, IAG ranks among the most vulnerable if spring's kerosene fears return to the fore, as is very likely right now.
0
|0