
Advertisement
- Sweden
- /
- Specialty Stores
- /
- OM:BILI A
How Does Bilia's (STO:BILI A) P/E Compare To Its Industry, After The Share Price Drop?
Unfortunately for some shareholders, the Bilia (STO:BILI A) share price has dived 35% in the last thirty days. The recent drop has obliterated the annual return, with the share price now down 14% over that longer period.
Assuming nothing else has changed, a lower share price makes a stock more attractive to potential buyers. In the long term, share prices tend to follow earnings per share, but in the short term prices bounce around in response to short term factors (which are not always obvious). So, on certain occasions, long term focussed investors try to take advantage of pessimistic expectations to buy shares at a better price. One way to gauge market expectations of a stock is to look at its Price to Earnings Ratio (PE Ratio). A high P/E ratio means that investors have a high expectation about future growth, while a low P/E ratio means they have low expectations about future growth.
See our latest analysis for Bilia
How Does Bilia's P/E Ratio Compare To Its Peers?
Bilia's P/E of 8.88 indicates relatively low sentiment towards the stock. If you look at the image below, you can see Bilia has a lower P/E than the average (14.5) in the specialty retail industry classification.
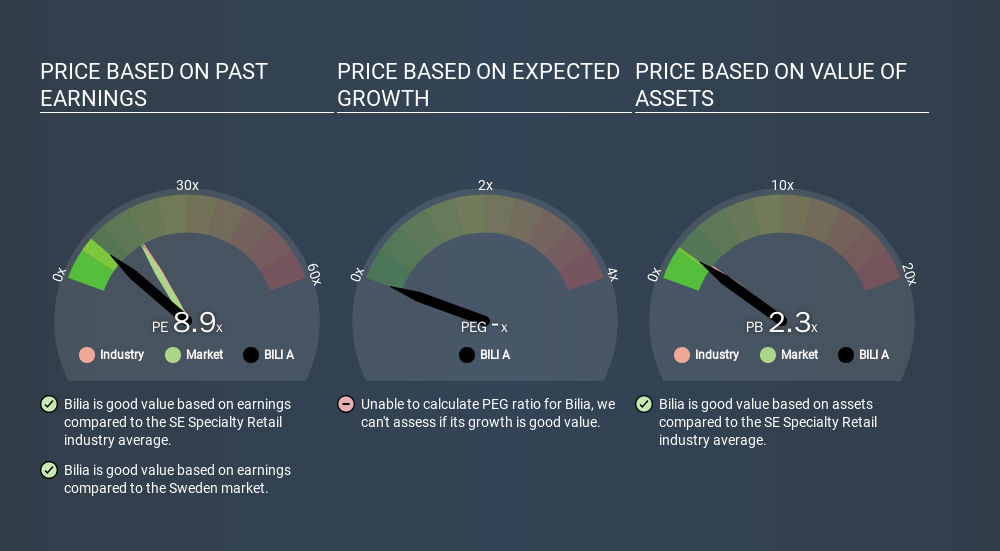
Its relatively low P/E ratio indicates that Bilia shareholders think it will struggle to do as well as other companies in its industry classification. Since the market seems unimpressed with Bilia, it's quite possible it could surprise on the upside. You should delve deeper. I like to check if company insiders have been buying or selling.
How Growth Rates Impact P/E Ratios
Earnings growth rates have a big influence on P/E ratios. Earnings growth means that in the future the 'E' will be higher. That means even if the current P/E is high, it will reduce over time if the share price stays flat. And as that P/E ratio drops, the company will look cheap, unless its share price increases.
Most would be impressed by Bilia earnings growth of 10% in the last year. And its annual EPS growth rate over 5 years is 12%. So one might expect an above average P/E ratio.
Don't Forget: The P/E Does Not Account For Debt or Bank Deposits
It's important to note that the P/E ratio considers the market capitalization, not the enterprise value. Thus, the metric does not reflect cash or debt held by the company. Hypothetically, a company could reduce its future P/E ratio by spending its cash (or taking on debt) to achieve higher earnings.
While growth expenditure doesn't always pay off, the point is that it is a good option to have; but one that the P/E ratio ignores.
Is Debt Impacting Bilia's P/E?
Bilia's net debt equates to 28% of its market capitalization. While that's enough to warrant consideration, it doesn't really concern us.
The Bottom Line On Bilia's P/E Ratio
Bilia trades on a P/E ratio of 8.9, which is below the SE market average of 14.5. The EPS growth last year was strong, and debt levels are quite reasonable. The low P/E ratio suggests current market expectations are muted, implying these levels of growth will not continue. Given Bilia's P/E ratio has declined from 13.6 to 8.9 in the last month, we know for sure that the market is more worried about the business today, than it was back then. For those who prefer to invest with the flow of momentum, that might be a bad sign, but for deep value investors this stock might justify some research.
Investors should be looking to buy stocks that the market is wrong about. If it is underestimating a company, investors can make money by buying and holding the shares until the market corrects itself. We don't have analyst forecasts, but you could get a better understanding of its growth by checking out this more detailed historical graph of earnings, revenue and cash flow.
You might be able to find a better buy than Bilia. If you want a selection of possible winners, check out this free list of interesting companies that trade on a P/E below 20 (but have proven they can grow earnings).
If you spot an error that warrants correction, please contact the editor at editorial-team@simplywallst.com. This article by Simply Wall St is general in nature. It does not constitute a recommendation to buy or sell any stock, and does not take account of your objectives, or your financial situation. Simply Wall St has no position in the stocks mentioned.
We aim to bring you long-term focused research analysis driven by fundamental data. Note that our analysis may not factor in the latest price-sensitive company announcements or qualitative material. Thank you for reading.
About OM:BILI A
Bilia
Operates as a full-service supplier for car ownership in Sweden, Norway, Luxembourg, and Belgium.
Good value with moderate growth potential.
Market Insights


Advertisement
Weekly Picks
CE


Ceazar on Sparc AI ·
When GPS fails: this small cap is fixing a $54B drone problem
Fair Value:CA$5.2540.2% undervalued
94 followersusers have followed this narrative
0 commentsusers have commented on this narrative
23 likesusers have liked this narrative
HA


HarishPK on lululemon athletica ·
Quantifying the Transition: Why Lululemon’s Moat Remains Intact
Fair Value:US$161.828.5% undervalued
5 followersusers have followed this narrative
0 commentsusers have commented on this narrative
5 likesusers have liked this narrative
TR


tripledub on Alphabet ·
Warren Buffett Just Bet $10 Billion on Google. The Catch? You May Already Be Too Late.
Fair Value:US$23059.3% overvalued
37 followersusers have followed this narrative
1 commentusers have commented on this narrative
9 likesusers have liked this narrative
JO


John_Eric on Veeva Systems ·
AI-Powered Veeva Systems Poised for Solid Growth Amid Regulatory Stability
Fair Value:US$32040.0% undervalued
7 followersusers have followed this narrative
0 commentsusers have commented on this narrative
0 likesusers have liked this narrative
Recently Updated Narratives
RO


RockeTeller on Revival Gold ·
7,000% US Based Idaho & Utah Gold Miner Play, Beartrack + Mercur: $1.2B+ NAV Leverage with Strong Management
Fair Value:CA$12.7194.4% undervalued
9 followersusers have followed this narrative
1 commentusers have commented on this narrative
0 likesusers have liked this narrative
NO

NordicWolf on Carlsberg ·
Defensive Beverage Compounder With Britvic Upside
Fair Value:DKK 870.327.5% overvalued
1 followerusers have followed this narrative
0 commentsusers have commented on this narrative
0 likesusers have liked this narrative
DA


DaneDruss on Cloudflare ·
Q-Day: Quantum Hype vs Quantum-Safe Infrastructure
Fair Value:US$167.4547.8% overvalued
2 followersusers have followed this narrative
0 commentsusers have commented on this narrative
0 likesusers have liked this narrative
Popular Narratives
IN


Investingwilly on Mastercard ·
Mastercard: The Best Dividend Stock You're Ignoring
Fair Value:US$75028.9% undervalued
84 followersusers have followed this narrative
1 commentusers have commented on this narrative
9 likesusers have liked this narrative
HA

HarishPK on Adobe ·
Adobe: A Probabilistic Case for Undervaluation
Fair Value:US$319.9631.8% undervalued
64 followersusers have followed this narrative
9 commentsusers have commented on this narrative
19 likesusers have liked this narrative
BL


BlackGoat on Cerebras Systems ·
The Wafer Giant Threatening NVIDIA's GPU Hegemony
Fair Value:US$415.5453.8% undervalued
58 followersusers have followed this narrative
1 commentusers have commented on this narrative
10 likesusers have liked this narrative
Trending Discussion


MW

mwod31 on Greatland Resources ·
A great comment, WSB have not done the research imo. I intend to buy more shares in 2026.
0
|0