Advertisement
- Australia
- /
- Real Estate
- /
- ASX:LLC
Here's Why Lendlease Group (ASX:LLC) Is Weighed Down By Its Debt Load
Warren Buffett famously said, 'Volatility is far from synonymous with risk.' So it seems the smart money knows that debt - which is usually involved in bankruptcies - is a very important factor, when you assess how risky a company is. Importantly, Lendlease Group (ASX:LLC) does carry debt. But the real question is whether this debt is making the company risky.
When Is Debt Dangerous?
Debt assists a business until the business has trouble paying it off, either with new capital or with free cash flow. Part and parcel of capitalism is the process of 'creative destruction' where failed businesses are mercilessly liquidated by their bankers. However, a more common (but still painful) scenario is that it has to raise new equity capital at a low price, thus permanently diluting shareholders. Of course, debt can be an important tool in businesses, particularly capital heavy businesses. When we think about a company's use of debt, we first look at cash and debt together.
View our latest analysis for Lendlease Group
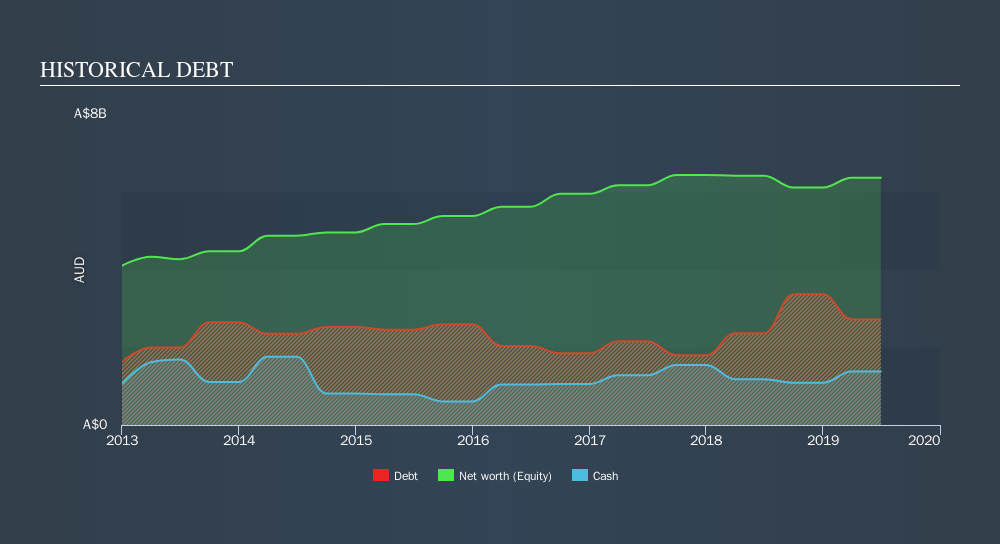
What Is Lendlease Group's Debt?
You can click the graphic below for the historical numbers, but it shows that as of June 2019 Lendlease Group had AU$2.72b of debt, an increase on AU$2.36b, over one year. On the flip side, it has AU$1.38b in cash leading to net debt of about AU$1.34b.
A Look At Lendlease Group's Liabilities
We can see from the most recent balance sheet that Lendlease Group had liabilities of AU$6.29b falling due within a year, and liabilities of AU$4.53b due beyond that. Offsetting this, it had AU$1.38b in cash and AU$2.06b in receivables that were due within 12 months. So its liabilities total AU$7.38b more than the combination of its cash and short-term receivables.
This is a mountain of leverage relative to its market capitalization of AU$10.1b. Should its lenders demand that it shore up the balance sheet, shareholders would likely face severe dilution.
In order to size up a company's debt relative to its earnings, we calculate its net debt divided by its earnings before interest, tax, depreciation, and amortization (EBITDA) and its earnings before interest and tax (EBIT) divided by its interest expense (its interest cover). Thus we consider debt relative to earnings both with and without depreciation and amortization expenses.
Lendlease Group shareholders face the double whammy of a high net debt to EBITDA ratio (5.1), and fairly weak interest coverage, since EBIT is just 1.2 times the interest expense. This means we'd consider it to have a heavy debt load. Worse, Lendlease Group's EBIT was down 78% over the last year. If earnings continue to follow that trajectory, paying off that debt load will be harder than convincing us to run a marathon in the rain. The balance sheet is clearly the area to focus on when you are analysing debt. But it is future earnings, more than anything, that will determine Lendlease Group's ability to maintain a healthy balance sheet going forward. So if you want to see what the professionals think, you might find this free report on analyst profit forecasts to be interesting.
Finally, a company can only pay off debt with cold hard cash, not accounting profits. So we always check how much of that EBIT is translated into free cash flow. Over the last three years, Lendlease Group recorded negative free cash flow, in total. Debt is usually more expensive, and almost always more risky in the hands of a company with negative free cash flow. Shareholders ought to hope for and improvement.
Our View
On the face of it, Lendlease Group's interest cover left us tentative about the stock, and its EBIT growth rate was no more enticing than the one empty restaurant on the busiest night of the year. And even its net debt to EBITDA fails to inspire much confidence. Taking into account all the aforementioned factors, it looks like Lendlease Group has too much debt. While some investors love that sort of risky play, it's certainly not our cup of tea. Given our concerns about Lendlease Group's debt levels, it seems only prudent to check if insiders have been ditching the stock.
If, after all that, you're more interested in a fast growing company with a rock-solid balance sheet, then check out our list of net cash growth stocks without delay.
We aim to bring you long-term focused research analysis driven by fundamental data. Note that our analysis may not factor in the latest price-sensitive company announcements or qualitative material.
If you spot an error that warrants correction, please contact the editor at editorial-team@simplywallst.com. This article by Simply Wall St is general in nature. It does not constitute a recommendation to buy or sell any stock, and does not take account of your objectives, or your financial situation. Simply Wall St has no position in the stocks mentioned. Thank you for reading.
About ASX:LLC
Lendlease Group
Operates as an integrated real estate and investment company in Australia, Asia, Europe, and the Americas.
Reasonable growth potential and fair value.
Similar Companies
Market Insights


Advertisement
Weekly Picks
LO


Lou_Basenese on Cue Biopharma ·
Cue Biopharma (NASDAQ: CUE): The Scientist Behind Xolair Just Gave Cue a Next-Generation Shot at the Same Multi-Billion-Dollar Market
Fair Value:US$7063.2% undervalued
43 followersusers have followed this narrative
0 commentsusers have commented on this narrative
9 likesusers have liked this narrative
HA


HarishPK on Adobe ·
Adobe: A Probabilistic Case for Undervaluation
Fair Value:US$319.9635.5% undervalued
46 followersusers have followed this narrative
8 commentsusers have commented on this narrative
16 likesusers have liked this narrative
NI


niteco on Broadcom ·
A Capital Allocation Favorite with Structural Importance
Fair Value:US$651.0539.5% undervalued
45 followersusers have followed this narrative
0 commentsusers have commented on this narrative
8 likesusers have liked this narrative
TO


Tokyo on Okta ·
Good foundation, but now it's all about the next steps
Fair Value:US$15121.8% undervalued
91 followersusers have followed this narrative
7 commentsusers have commented on this narrative
11 likesusers have liked this narrative
Recently Updated Narratives
RO


RockeTeller on Investigator Silver ·
Investigator Silver, Leverage Exposed: $1/oz Move = $42M Cash for This ASX Developer
Fair Value:AU$2.3997.7% undervalued
14 followersusers have followed this narrative
0 commentsusers have commented on this narrative
1 likeusers have liked this narrative
TA


Talos on Voyager Technologies ·
The "Landlord of Orbit" – A Deep Value Play Ahead of the Starlab Era
Fair Value:US$385.289.5% undervalued
17 followersusers have followed this narrative
0 commentsusers have commented on this narrative
0 likesusers have liked this narrative
TA

Talos on Advanced Micro Devices ·
The "David vs. Goliath" AI Trade – Why Second Place is Worth Billions
Fair Value:US$907.3239.7% undervalued
37 followersusers have followed this narrative
1 commentusers have commented on this narrative
0 likesusers have liked this narrative
Popular Narratives
MA


martinarauz on Nu Holdings ·
Investment Analysis (May 2026)
Fair Value:US$22.7445.3% undervalued
66 followersusers have followed this narrative
0 commentsusers have commented on this narrative
16 likesusers have liked this narrative
CL


Clive_Thompson on Take-Two Interactive Software ·
Take-Two Interactive: The Calm Before the Storm NASDAQ: TTWO Last Price: $242.41 Date: May 15, 2026
Fair Value:US$276.9721.9% undervalued
58 followersusers have followed this narrative
0 commentsusers have commented on this narrative
14 likesusers have liked this narrative
NI

niteco on Honeywell International ·
Honeywell - The Demand-Side of the AI Infrastructure
Fair Value:US$320.1929.0% undervalued
51 followersusers have followed this narrative
0 commentsusers have commented on this narrative
19 likesusers have liked this narrative
