Advertisement
- United States
- /
- Healthtech
- /
- NasdaqGS:SLP
Here's What Simulations Plus, Inc.'s (NASDAQ:SLP) P/E Is Telling Us
The goal of this article is to teach you how to use price to earnings ratios (P/E ratios). To keep it practical, we'll show how Simulations Plus, Inc.'s (NASDAQ:SLP) P/E ratio could help you assess the value on offer. Based on the last twelve months, Simulations Plus's P/E ratio is 78.87. That corresponds to an earnings yield of approximately 1.3%.
See our latest analysis for Simulations Plus
How Do You Calculate A P/E Ratio?
The formula for price to earnings is:
Price to Earnings Ratio = Price per Share ÷ Earnings per Share (EPS)
Or for Simulations Plus:
P/E of 78.87 = $35.53 ÷ $0.45 (Based on the year to May 2019.)
Is A High Price-to-Earnings Ratio Good?
A higher P/E ratio means that buyers have to pay a higher price for each $1 the company has earned over the last year. That isn't necessarily good or bad, but a high P/E implies relatively high expectations of what a company can achieve in the future.
Does Simulations Plus Have A Relatively High Or Low P/E For Its Industry?
The P/E ratio essentially measures market expectations of a company. The image below shows that Simulations Plus has a higher P/E than the average (54.0) P/E for companies in the healthcare services industry.
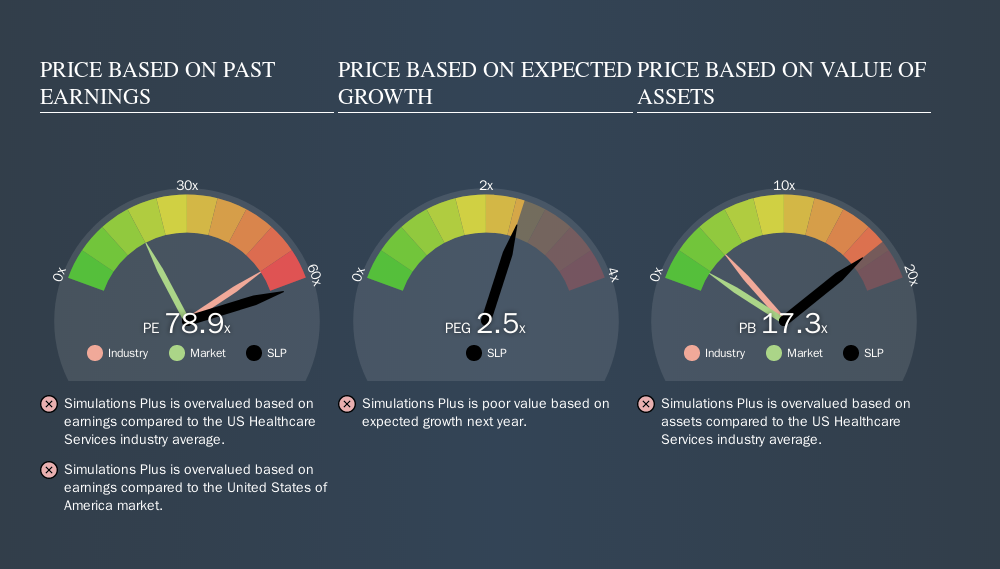
Simulations Plus's P/E tells us that market participants think the company will perform better than its industry peers, going forward.
How Growth Rates Impact P/E Ratios
Probably the most important factor in determining what P/E a company trades on is the earnings growth. When earnings grow, the 'E' increases, over time. That means even if the current P/E is high, it will reduce over time if the share price stays flat. And as that P/E ratio drops, the company will look cheap, unless its share price increases.
Simulations Plus saw earnings per share decrease by 11% last year. But over the longer term (5 years) earnings per share have increased by 19%. Shareholders have some reason to be optimistic, but the future is always uncertain. So investors should delve deeper. I like to check if company insiders have been buying or selling.
Don't Forget: The P/E Does Not Account For Debt or Bank Deposits
Don't forget that the P/E ratio considers market capitalization. So it won't reflect the advantage of cash, or disadvantage of debt. The exact same company would hypothetically deserve a higher P/E ratio if it had a strong balance sheet, than if it had a weak one with lots of debt, because a cashed up company can spend on growth.
While growth expenditure doesn't always pay off, the point is that it is a good option to have; but one that the P/E ratio ignores.
Simulations Plus's Balance Sheet
Since Simulations Plus holds net cash of US$10m, it can spend on growth, justifying a higher P/E ratio than otherwise.
The Bottom Line On Simulations Plus's P/E Ratio
With a P/E ratio of 78.9, Simulations Plus is expected to grow earnings very strongly in the years to come. Falling earnings per share is probably keeping traditional value investors away, but the net cash position means the company has time to improve: and the high P/E suggests the market thinks it will.
When the market is wrong about a stock, it gives savvy investors an opportunity. If the reality for a company is better than it expects, you can make money by buying and holding for the long term. So this free visual report on analyst forecasts could hold the key to an excellent investment decision.
You might be able to find a better buy than Simulations Plus. If you want a selection of possible winners, check out this free list of interesting companies that trade on a P/E below 20 (but have proven they can grow earnings).
We aim to bring you long-term focused research analysis driven by fundamental data. Note that our analysis may not factor in the latest price-sensitive company announcements or qualitative material.
If you spot an error that warrants correction, please contact the editor at editorial-team@simplywallst.com. This article by Simply Wall St is general in nature. It does not constitute a recommendation to buy or sell any stock, and does not take account of your objectives, or your financial situation. Simply Wall St has no position in the stocks mentioned. Thank you for reading.
About NasdaqGS:SLP
Simulations Plus
Develops drug discovery and development software for modeling and simulation, and prediction of molecular properties utilizing artificial intelligence and machine learning based technology worldwide.
Flawless balance sheet with moderate growth potential.
Similar Companies
Market Insights


Advertisement
Weekly Picks
ST


stuart_roberts on Unicycive Therapeutics ·
Looking to be second time lucky with a game-changing new product
Fair Value:US$21.5361.6% undervalued
142 followersusers have followed this narrative
0 commentsusers have commented on this narrative
19 likesusers have liked this narrative
DE


Degen_GCR on Everpure ·
Second order memory play likely to double in a year
Fair Value:US$18054.9% undervalued
25 followersusers have followed this narrative
1 commentusers have commented on this narrative
16 likesusers have liked this narrative
DO


Double_Bubbler on Intuitive Machines ·
Intuitive Machines: To The Moon and Beyond!
Fair Value:US$42.319.9% undervalued
15 followersusers have followed this narrative
0 commentsusers have commented on this narrative
5 likesusers have liked this narrative
YI

yiannisz on AppLovin ·
AppLovin’s AI Engine Is Printing Profit
Fair Value:US$989.2449.4% undervalued
33 followersusers have followed this narrative
2 commentsusers have commented on this narrative
1 likeusers have liked this narrative
Recently Updated Narratives
KA


kapirey on Partners Group Holding ·
Partners Group Holding will achieve an 8.14% revenue rise over the next 5 years
Fair Value:CHF 68030.3% overvalued
1 followerusers have followed this narrative
0 commentsusers have commented on this narrative
0 likesusers have liked this narrative
KA

kapirey on Cosmo ·
Cosmo Pharmaceuticals Announces Strong Full Year 2024 Revenue and Cash and Provides Business and Pipeline Updates
Fair Value:CHF 10023.8% undervalued
84 followersusers have followed this narrative
0 commentsusers have commented on this narrative
0 likesusers have liked this narrative
KA

kapirey on STIF Société anonyme ·
Niche global leader in BESS explosion protection
Fair Value:€6014.7% undervalued
1 followerusers have followed this narrative
0 commentsusers have commented on this narrative
0 likesusers have liked this narrative
Popular Narratives
GO

GoldenSands on QuantumScape ·
QuantumScape: A Mispriced Deep‑Tech Inflection Point With Multi‑Billion‑Dollar Optionality
Fair Value:US$8590.6% undervalued
111 followersusers have followed this narrative
2 commentsusers have commented on this narrative
31 likesusers have liked this narrative
TR


tripledub on Meta Platforms ·
The $135 Billion Bet That Should Make Every Shareholder Nervous
Fair Value:US$74017.0% undervalued
39 followersusers have followed this narrative
3 commentsusers have commented on this narrative
33 likesusers have liked this narrative
AN


AnalystConsensusTarget on NVIDIA ·
NVDA: Expanding AI Demand Will Drive Major Data Center Investments Through 2026
Fair Value:US$268.6116.1% undervalued
1183 followersusers have followed this narrative
7 commentsusers have commented on this narrative
34 likesusers have liked this narrative

