Advertisement
- United Kingdom
- /
- Trade Distributors
- /
- LSE:RS1
Here's What Electrocomponents plc's (LON:ECM) ROCE Can Tell Us
Today we'll look at Electrocomponents plc (LON:ECM) and reflect on its potential as an investment. To be precise, we'll consider its Return On Capital Employed (ROCE), as that will inform our view of the quality of the business.
First of all, we'll work out how to calculate ROCE. Second, we'll look at its ROCE compared to similar companies. Last but not least, we'll look at what impact its current liabilities have on its ROCE.
What is Return On Capital Employed (ROCE)?
ROCE is a metric for evaluating how much pre-tax income (in percentage terms) a company earns on the capital invested in its business. Generally speaking a higher ROCE is better. Overall, it is a valuable metric that has its flaws. Renowned investment researcher Michael Mauboussin has suggested that a high ROCE can indicate that 'one dollar invested in the company generates value of more than one dollar'.
How Do You Calculate Return On Capital Employed?
The formula for calculating the return on capital employed is:
Return on Capital Employed = Earnings Before Interest and Tax (EBIT) ÷ (Total Assets - Current Liabilities)
Or for Electrocomponents:
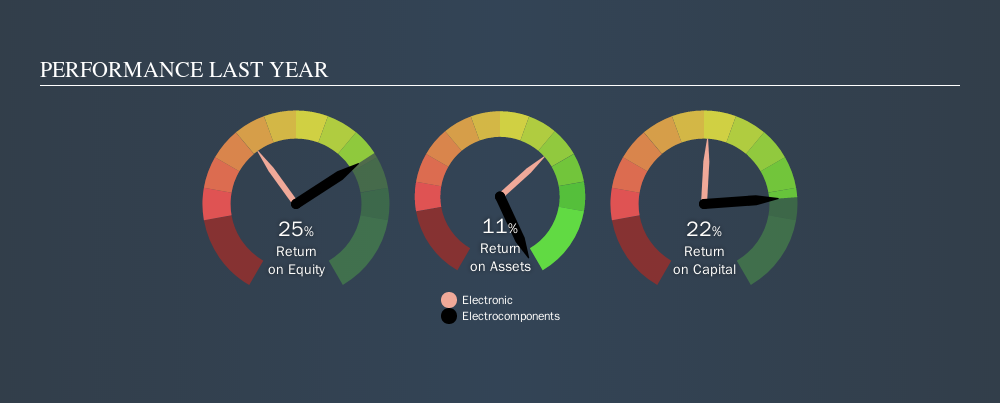
0.22 = UK£203m ÷ (UK£1.4b - UK£488m) (Based on the trailing twelve months to March 2019.)
So, Electrocomponents has an ROCE of 22%.
See our latest analysis for Electrocomponents
Does Electrocomponents Have A Good ROCE?
One way to assess ROCE is to compare similar companies. Using our data, we find that Electrocomponents's ROCE is meaningfully better than the 13% average in the Electronic industry. I think that's good to see, since it implies the company is better than other companies at making the most of its capital. Regardless of the industry comparison, in absolute terms, Electrocomponents's ROCE currently appears to be excellent.
We can see that, Electrocomponents currently has an ROCE of 22% compared to its ROCE 3 years ago, which was 12%. This makes us wonder if the company is improving. The image below shows how Electrocomponents's ROCE compares to its industry.
It is important to remember that ROCE shows past performance, and is not necessarily predictive. ROCE can be misleading for companies in cyclical industries, with returns looking impressive during the boom times, but very weak during the busts. ROCE is only a point-in-time measure. Since the future is so important for investors, you should check out our free report on analyst forecasts for Electrocomponents.
Do Electrocomponents's Current Liabilities Skew Its ROCE?
Short term (or current) liabilities, are things like supplier invoices, overdrafts, or tax bills that need to be paid within 12 months. Due to the way ROCE is calculated, a high level of current liabilities makes a company look as though it has less capital employed, and thus can (sometimes unfairly) boost the ROCE. To check the impact of this, we calculate if a company has high current liabilities relative to its total assets.
Electrocomponents has total assets of UK£1.4b and current liabilities of UK£488m. Therefore its current liabilities are equivalent to approximately 35% of its total assets. A medium level of current liabilities boosts Electrocomponents's ROCE somewhat.
What We Can Learn From Electrocomponents's ROCE
Still, it has a high ROCE, and may be an interesting prospect for further research. There might be better investments than Electrocomponents out there, but you will have to work hard to find them . These promising businesses with rapidly growing earnings might be right up your alley.
For those who like to find winning investments this free list of growing companies with recent insider purchasing, could be just the ticket.
We aim to bring you long-term focused research analysis driven by fundamental data. Note that our analysis may not factor in the latest price-sensitive company announcements or qualitative material.
If you spot an error that warrants correction, please contact the editor at editorial-team@simplywallst.com. This article by Simply Wall St is general in nature. It does not constitute a recommendation to buy or sell any stock, and does not take account of your objectives, or your financial situation. Simply Wall St has no position in the stocks mentioned. Thank you for reading.
About LSE:RS1
RS Group
Engages in the distribution of maintenance, repair, and operations products and service solutions in the United Kingdom, the United States, France, Mexico, Germany, Italy, Switzerland, and internationally.
Excellent balance sheet established dividend payer.
Similar Companies
Market Insights


Advertisement
Weekly Picks
LO


Lou_Basenese on Optimi Health ·
The Only Psychedelic Company Already Selling MDMA and Psilocybin to Real Patients, Yet Priced Like It Doesn’t Exist
Fair Value:US$1157.5% undervalued
47 followersusers have followed this narrative
2 commentsusers have commented on this narrative
7 likesusers have liked this narrative
WE


WealthAP on Novo Nordisk ·
Novo Nordisk (NVO): Is the "Easy Growth" Story Over?
Fair Value:DKK 407.7721.4% undervalued
69 followersusers have followed this narrative
0 commentsusers have commented on this narrative
8 likesusers have liked this narrative
VA


ValueInvestingSubstack on Zoetis ·
Zoetis down -50% over the past year
Fair Value:US$92.9218.9% undervalued
23 followersusers have followed this narrative
0 commentsusers have commented on this narrative
9 likesusers have liked this narrative
CE


CentryResearch on Centrus Energy ·
Centrus Energy: The Next Nuclear Bottleneck Isn't Reactors. It's Fuel.
Fair Value:US$19013.7% undervalued
24 followersusers have followed this narrative
0 commentsusers have commented on this narrative
10 likesusers have liked this narrative
Recently Updated Narratives
WI

WisetoWealth on PayPal Holdings ·
The Underrated Transformation of a Digital Payments Giant
Fair Value:US$90.3137.8% undervalued
2 followersusers have followed this narrative
0 commentsusers have commented on this narrative
0 likesusers have liked this narrative
BL


Blagget on Terra Balcanica Resources ·
The C$4M Explorer Positioned to Become Europe's First Antimony Mine
Fair Value:CA$0.487.5% undervalued
2 followersusers have followed this narrative
0 commentsusers have commented on this narrative
0 likesusers have liked this narrative
DA

david_6nroa on Charter Communications ·
Charter is undervalued - Here's why.
Fair Value:US$87.0741.6% overvalued
1 followerusers have followed this narrative
0 commentsusers have commented on this narrative
0 likesusers have liked this narrative
Popular Narratives
CU

CubanEros on Microsoft ·
A wonderful business at reasonable price.
Fair Value:US$419.919.1% undervalued
81 followersusers have followed this narrative
0 commentsusers have commented on this narrative
6 likesusers have liked this narrative
OS


oscargarcia on NVIDIA ·
The company that went from selling GPUs to gamers to becoming the AI arms dealer of the 21st century.
Fair Value:US$28026.1% undervalued
186 followersusers have followed this narrative
9 commentsusers have commented on this narrative
15 likesusers have liked this narrative
BE
benjamin_lvieq on PayPal Holdings ·
PayPal: PayPal Doesn't Need to Grow – It Needs to Stop Falling – A Mispriced Cash Machine With a Cannibal Buyback
Fair Value:US$6513.6% undervalued
72 followersusers have followed this narrative
2 commentsusers have commented on this narrative
11 likesusers have liked this narrative
Trending Discussion
DE

derek_3wsdg on Teladoc Health ·
You’ve overlooked the activist investor factor. Travis Cocke’s Voss has announced 5% ownership through a 13G filing. They’ve added to that 5% since, and in doing so, have created a structural trap door for 27.42 Million Shares actively sold short. Chuck will announce lots of positives on July 29 but it’s what Voss announces shortly after that will rock the overextended Teledoc shorts. The Walmart partnership is the tip of the iceberg. The market is missing the sheer regulatory and enterprise friction of modern corporate healthcare. Teladoc isn't a "consumer app"; it is the primary digital infrastructure integrated directly into the legacy backends of Tier-1 insurance companies and fortune 500 employers, covering 105 million+ lives. Teladoc is acting as the digital top-of-funnel engine for the world's largest retailer. If Voss pushes the narrative that Teladoc is effectively the outsourced digital brain of Walmart's entire healthcare footprint, the fair value shifts from a basic health multiple to an enterprise distribution premium. Additionally , we are in a structural gold rush for high-quality, legally compliant, longitudinal medical data to train vertical healthcare AI models. Large technology hyperscalers and pharmaceutical giants cannot simply scrape the internet for this; they need structured clinical inputs. Teladoc sits on one of the largest de-identified virtual medical datasets on earth. From the activist playbook , we’ll see Voss demand the immediate creation of a Data & Diagnostics Licensing Division, transforming a legacy liability into an incredibly high-margin, pure-software data asset that requires zero human clinician hours to scale. Chuck is doing great work and deserves credi5 for the Teledoc turnaround but it will be Travis Cocke who will be responsible for a share price way beyond your $15 valuation.
1
|0

