Advertisement
- United Kingdom
- /
- Specialty Stores
- /
- LSE:DNLM
Here's What Dunelm Group plc's (LON:DNLM) P/E Is Telling Us
Want to participate in a short research study? Help shape the future of investing tools and you could win a $250 gift card!
Today, we'll introduce the concept of the P/E ratio for those who are learning about investing. We'll apply a basic P/E ratio analysis to Dunelm Group plc's (LON:DNLM), to help you decide if the stock is worth further research. Based on the last twelve months, Dunelm Group's P/E ratio is 22.11. That means that at current prices, buyers pay £22.11 for every £1 in trailing yearly profits.
View our latest analysis for Dunelm Group
How Do I Calculate A Price To Earnings Ratio?
The formula for P/E is:
Price to Earnings Ratio = Share Price ÷ Earnings per Share (EPS)
Or for Dunelm Group:
P/E of 22.11 = £9.21 ÷ £0.42 (Based on the trailing twelve months to December 2018.)
Is A High P/E Ratio Good?
A higher P/E ratio means that buyers have to pay a higher price for each £1 the company has earned over the last year. That isn't necessarily good or bad, but a high P/E implies relatively high expectations of what a company can achieve in the future.
How Growth Rates Impact P/E Ratios
If earnings fall then in the future the 'E' will be lower. That means unless the share price falls, the P/E will increase in a few years. Then, a higher P/E might scare off shareholders, pushing the share price down.
It's great to see that Dunelm Group grew EPS by 14% in the last year. In contrast, EPS has decreased by 6.2%, annually, over 3 years.
How Does Dunelm Group's P/E Ratio Compare To Its Peers?
The P/E ratio essentially measures market expectations of a company. As you can see below, Dunelm Group has a higher P/E than the average company (12) in the specialty retail industry.
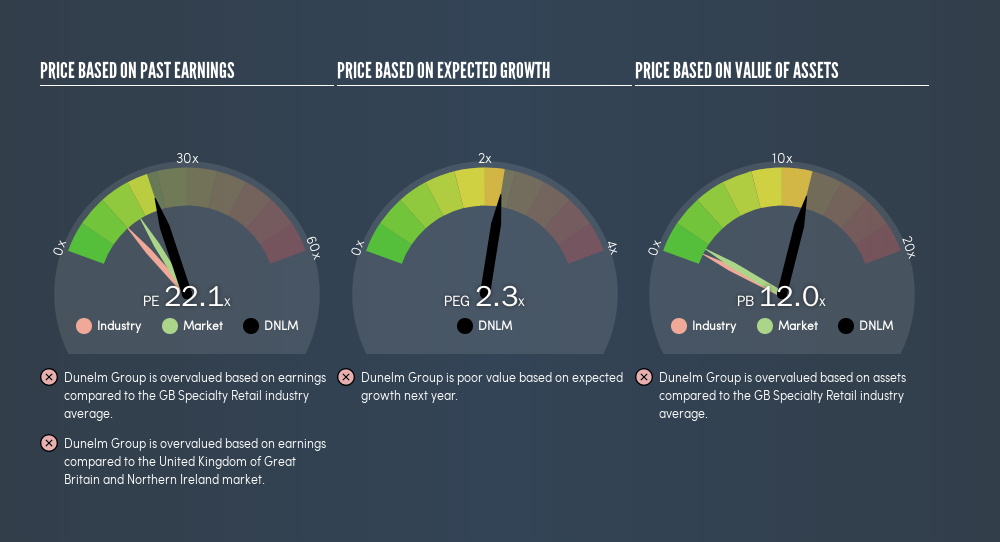
Dunelm Group's P/E tells us that market participants think the company will perform better than its industry peers, going forward.
A Limitation: P/E Ratios Ignore Debt and Cash In The Bank
One drawback of using a P/E ratio is that it considers market capitalization, but not the balance sheet. Thus, the metric does not reflect cash or debt held by the company. Theoretically, a business can improve its earnings (and produce a lower P/E in the future) by investing in growth. That means taking on debt (or spending its cash).
Spending on growth might be good or bad a few years later, but the point is that the P/E ratio does not account for the option (or lack thereof).
Is Debt Impacting Dunelm Group's P/E?
Dunelm Group has net debt worth just 3.9% of its market capitalization. It would probably trade on a higher P/E ratio if it had a lot of cash, but I doubt it is having a big impact.
The Verdict On Dunelm Group's P/E Ratio
Dunelm Group's P/E is 22.1 which is above average (16.4) in the GB market. Its debt levels do not imperil its balance sheet and it is growing EPS strongly. So on this analysis it seems reasonable that its P/E ratio is above average.
When the market is wrong about a stock, it gives savvy investors an opportunity. People often underestimate remarkable growth -- so investors can make money when fast growth is not fully appreciated. So this free report on the analyst consensus forecasts could help you make a master move on this stock.
Of course you might be able to find a better stock than Dunelm Group. So you may wish to see this free collection of other companies that have grown earnings strongly.
We aim to bring you long-term focused research analysis driven by fundamental data. Note that our analysis may not factor in the latest price-sensitive company announcements or qualitative material.
If you spot an error that warrants correction, please contact the editor at editorial-team@simplywallst.com. This article by Simply Wall St is general in nature. It does not constitute a recommendation to buy or sell any stock, and does not take account of your objectives, or your financial situation. Simply Wall St has no position in the stocks mentioned. Thank you for reading.
About LSE:DNLM
Dunelm Group
Engages in the retail of homewares in the United Kingdom.
Very undervalued established dividend payer.
Similar Companies
Market Insights


Advertisement
Weekly Picks
CE


Ceazar on Eva Live ·
This small cap is building the AI workforce of the future
Fair Value:US$7.4353.2% undervalued
71 followersusers have followed this narrative
0 commentsusers have commented on this narrative
15 likesusers have liked this narrative
TR


tripledub on lululemon athletica ·
Lululemon Got Boring Right About the Time It Got Cheap. That's Usually the Point
Fair Value:US$22043.1% undervalued
20 followersusers have followed this narrative
6 commentsusers have commented on this narrative
23 likesusers have liked this narrative
WO


woodworthfund on Kraft Heinz ·
Kraft Heinz (KHC): Less Drama, More Ketchup
Fair Value:US$3532.8% undervalued
6 followersusers have followed this narrative
0 commentsusers have commented on this narrative
2 likesusers have liked this narrative
CA


Canderous on PetroTal ·
Beyond 2026, Beyond a Double
Fair Value:CA$1.8168.5% undervalued
23 followersusers have followed this narrative
0 commentsusers have commented on this narrative
3 likesusers have liked this narrative
Recently Updated Narratives
IV

Ivoed on OCI ·
OCI is not being priced on asset value. That is the opportunity.
Fair Value:€6.5643.8% undervalued
2 followersusers have followed this narrative
0 commentsusers have commented on this narrative
0 likesusers have liked this narrative
IV

Ivoed on Kinepolis Group ·
Kinepolis Group Set to Achieve 22.52% Revenue Growth Boost, Experts Dream
Fair Value:€4839.0% undervalued
2 followersusers have followed this narrative
0 commentsusers have commented on this narrative
0 likesusers have liked this narrative
IV

Ivoed on Salesforce ·
Salesforce Future Value Could Reach $263 as Market Remains Short-Sighted
Fair Value:US$26331.5% undervalued
2 followersusers have followed this narrative
0 commentsusers have commented on this narrative
0 likesusers have liked this narrative
Popular Narratives
GO

GoldenSands on QuantumScape ·
QuantumScape: A Mispriced Deep‑Tech Inflection Point With Multi‑Billion‑Dollar Optionality
Fair Value:US$8591.0% undervalued
114 followersusers have followed this narrative
2 commentsusers have commented on this narrative
31 likesusers have liked this narrative
TR

tripledub on Meta Platforms ·
The $135 Billion Bet That Should Make Every Shareholder Nervous
Fair Value:US$74018.2% undervalued
39 followersusers have followed this narrative
3 commentsusers have commented on this narrative
33 likesusers have liked this narrative
AN


AnalystConsensusTarget on NVIDIA ·
NVDA: Expanding AI Demand Will Drive Major Data Center Investments Through 2026
Fair Value:US$268.6116.8% undervalued
1187 followersusers have followed this narrative
7 commentsusers have commented on this narrative
34 likesusers have liked this narrative